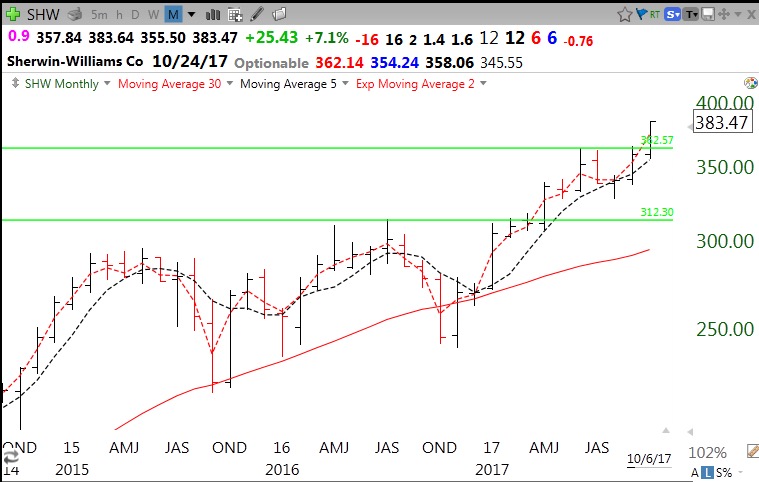
I reviewed a lot of stocks hitting all-time highs last week and found several that I thought were worthy of monitoring. On a monthly chart I draw a green line at the highest monthly price (all-time high) that has not been closed above for at least 3 months. In other words, the stock has hit an all time high and then rested or consolidated for at least three months. When it finally breaks above the green line on above average volume (GLB), it could be the start of a new advance. Here is an example of SHW. This monthly chart shows a green line top at 262.57 was made last June. I drew a green line there only after that peak was not closed above any month for at least three months.
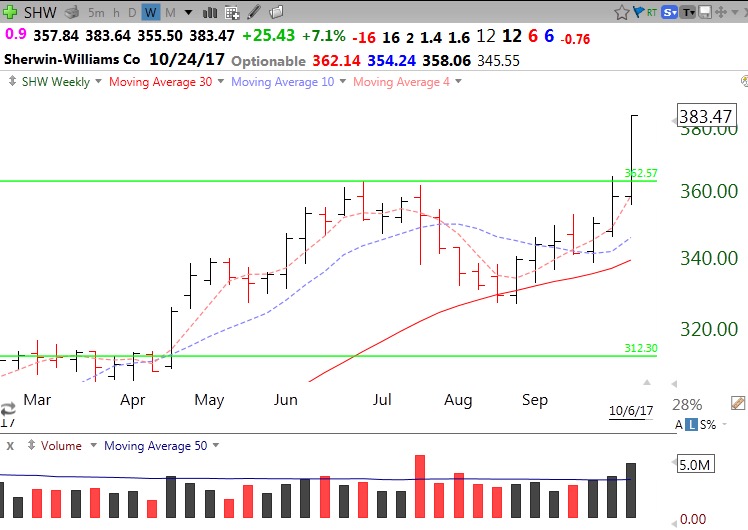
Last week SHW broke above its green line top on above average volume. Here is its weekly chart.
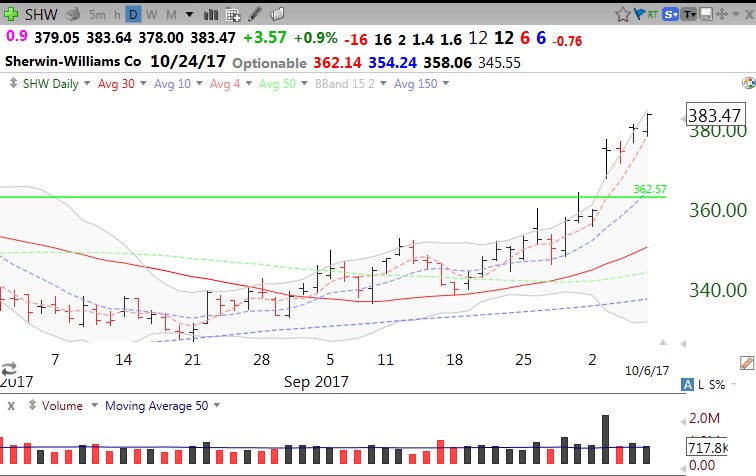
And here is its daily chart. Note the gap up on the day of the break-out–a good sign of technical strength.
When I buy a GLB, I sell immediately if the stock closes back below its green line. However, sometimes the stock kisses the green line, rests, and then moves up. I will then buy the stock back. It will be interesting to see how many of the 11 GLBs I listed will prove themselves…(FLXN, FWRD, IBKR, SSTI, SHW, UTMD, PAYX, FIVE, CW, ARGX, FIVN)
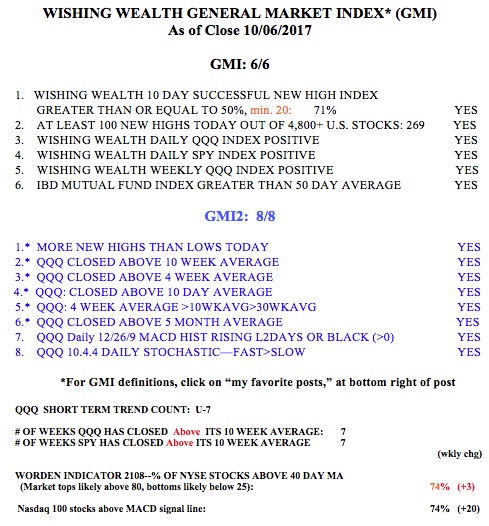
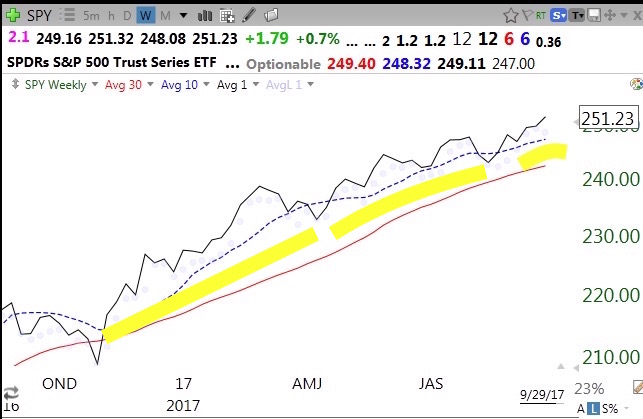
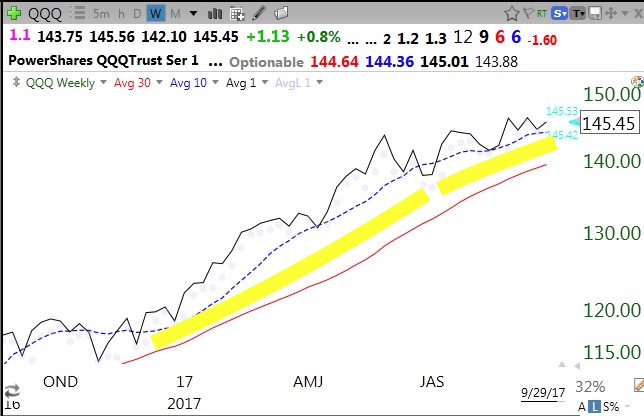
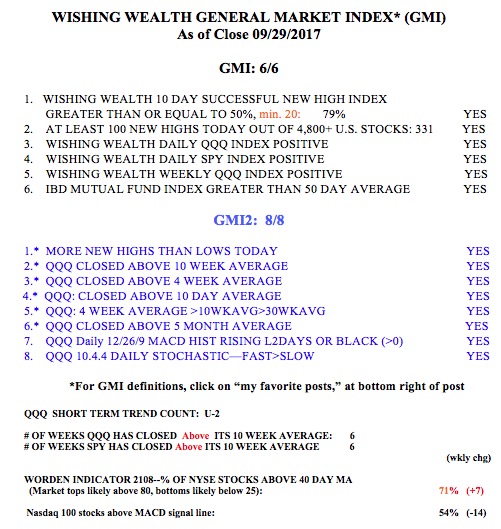
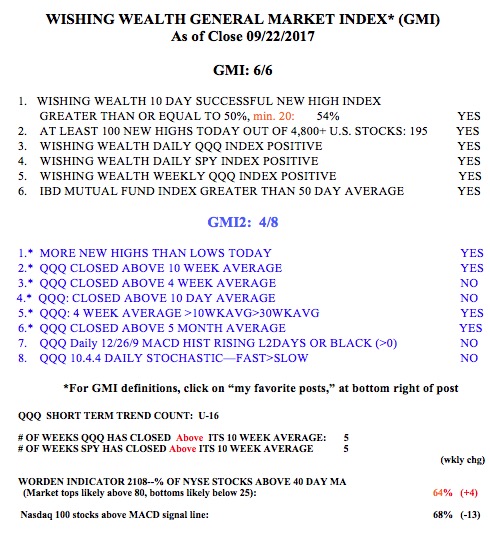
All of the GMI components remain positive.