I have always told you that I would let you know when I have sold out my trading accounts and/or exited the mutual funds in my university pension. On Friday, I decided to move all of my university pension accounts into money market funds. I had written here that I had gone to cash in my trading accounts weeks ago. My rare decision to also exit in my very conservative pension accounts stemmed from my unwillingness to watch them erode further when I have only a few years until I will rely on them to support my retirement. I would rather sit out this market and risk missing a 10-15% gain than to ride the market down that amount or more.
Why am I concerned? The tightening Fed and a resulting recession, a possible trade war, the weak technicals, and a large group of new investors who have never witnessed a bear market decline. The next bear market will cause many boomers to sell out (probably panic at the bottom) along with the millennials new to speculation.
The dirty little secret is that if a lot of people decide to sell their “safe” index mutual funds and ETFs at the same time, the redemptions will likely cause an avalanche of selling concentrated in the component stocks in the indexes. Instead of having individuals selling their portfolios containing a relatively small number of stocks, as occurred in the old days, there will be selling across all of the index components. The market always finds a way to surprise and inflict the most pain. Could this be the way that the explosion of investors seeking safety in index derivatives will be punished?
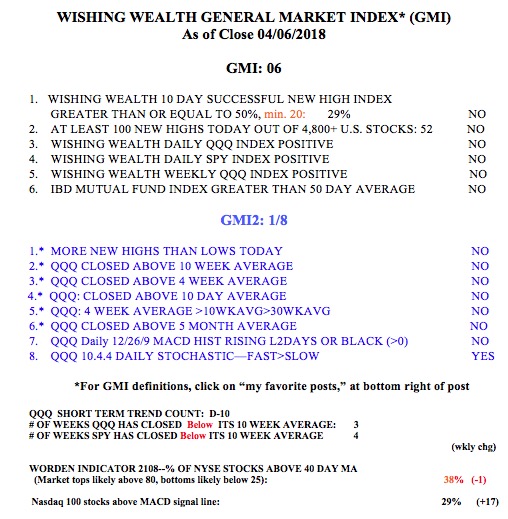
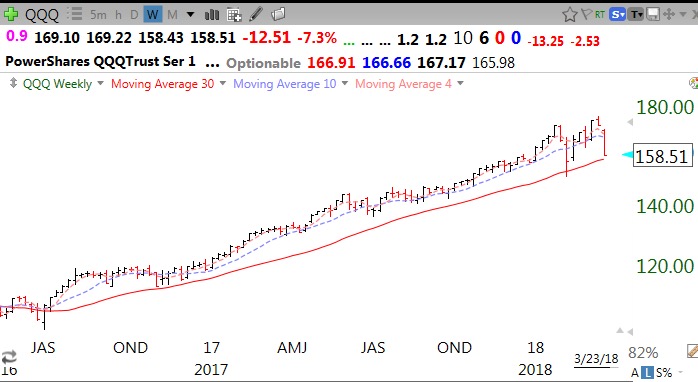
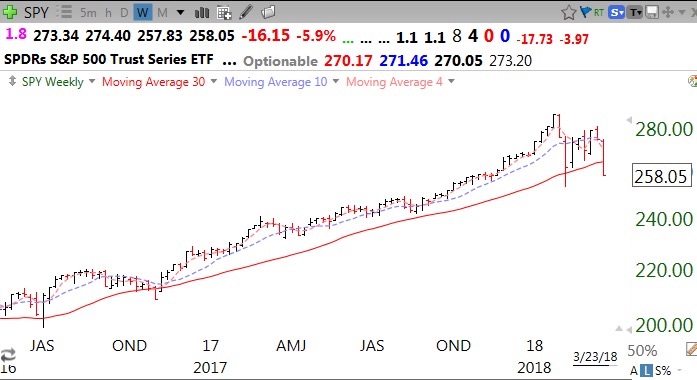
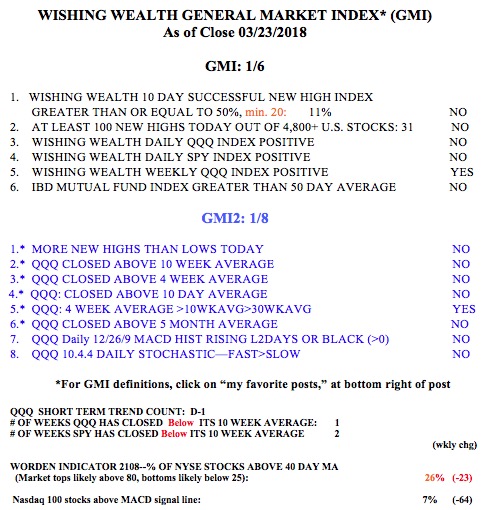
Meanwhile the GMI remains at 0 (of 6) and I remain peacefully on the sidelines. I know once I exit I have to make a future decision when to reinvest. However, as I see it, if I get out now and the market declines, as long as I can get back in near or below the level I exited, I come out ahead. I do not need to get back in at the bottom! And it really feels good now to get away from the stress induced by the markets these days…..