We growth stock investors are so focused on the innovative tech stocks that we often overlook the strongest non-tech stocks. For the month of December, 2017, the top 5 industries and their stocks hitting yearly highs on Friday were:
- Copper (+19.4%) FCX, SCCO
- Aluminum (+18.4%) KALU, AA
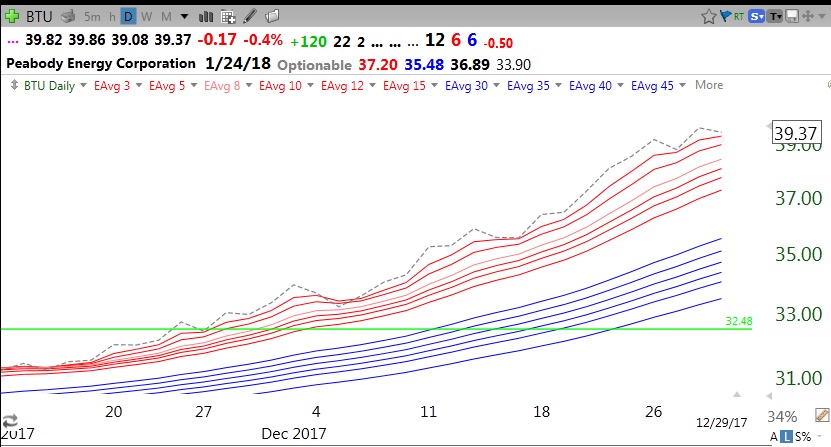
- Coal (+11.2%) BTU, ARCH
- Industrial metals and minerals (+9.8%) BBL, BHP, RIO, VALE, NEXA
- Steel (+8.6%) STLD
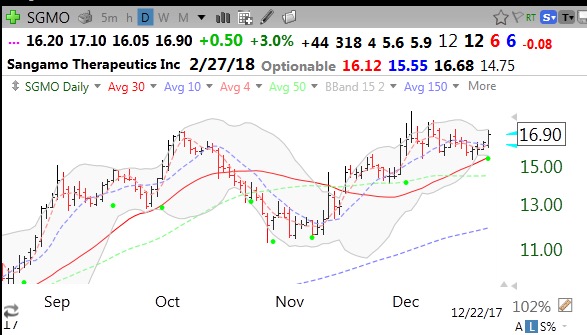
In comparison, semiconductors were up just +0.12% and internet content and information +2.9%. So maybe the US or the world is going to go on an infrastructure buying binge in 2018? Look at the beautiful RWB daily up-trend in BTU as an example of how nice and consistent move up it has had. It even had a green line break-out (GLB) to an all-time high in November.
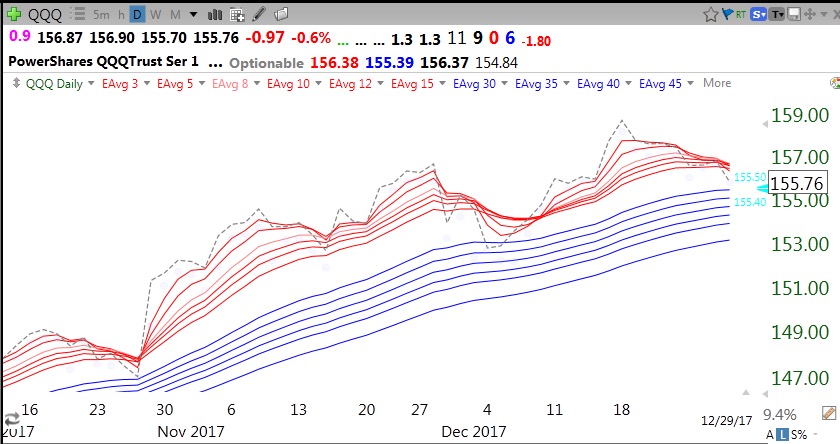
Meanwhile the tech stocks, as measured by QQQ, are in a short term decline. Note that the index has now closed (dotted line=closes) below all of its red line shorter term averages for the first time since early December. As long as it closes above the blue line averages I am not too concerned. However, the QQQ needs to close back above all of the red lines to resume the up-trend, as it did in October and December. The RWB pattern also needs to endure with all of the red lines above the blue lines with a white space between them. My blog glossary explains these technical patterns.
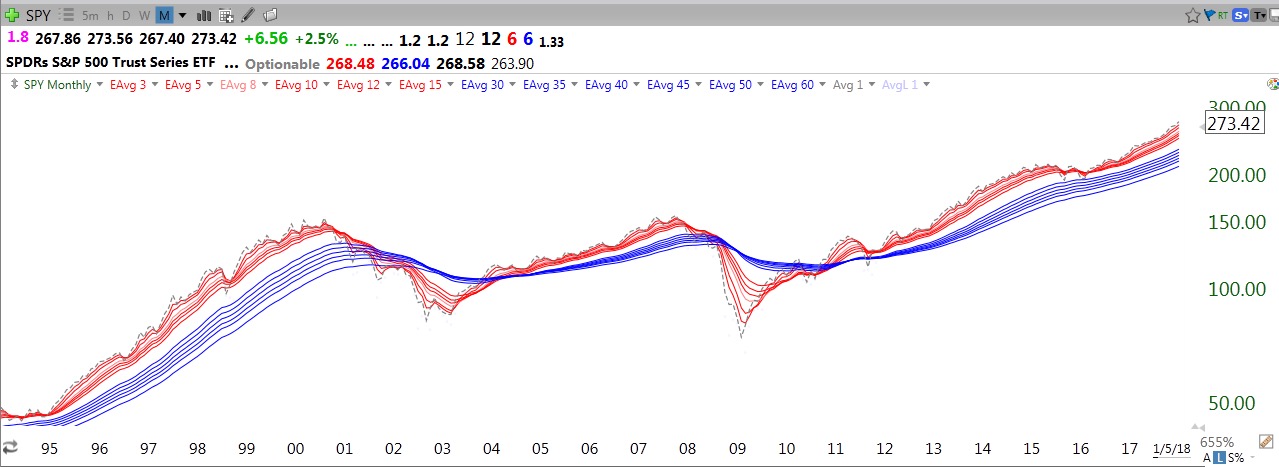
The SPY is somewhat stronger, perhaps reflecting its non-tech stock components. But it closed above only 2 red lines (see red 2 at top of chart).
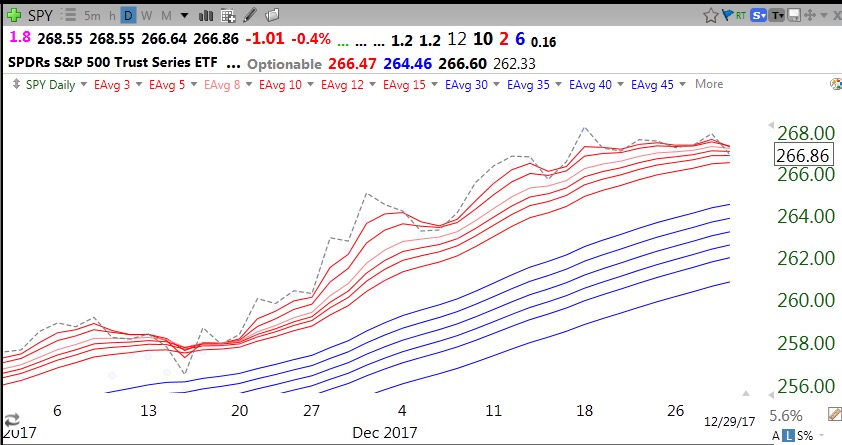
Nevertheless, we should heed the fact that both indexes have receded from their peaks reached in mid-December. I become concerned when many of the market leaders look wounded like these:
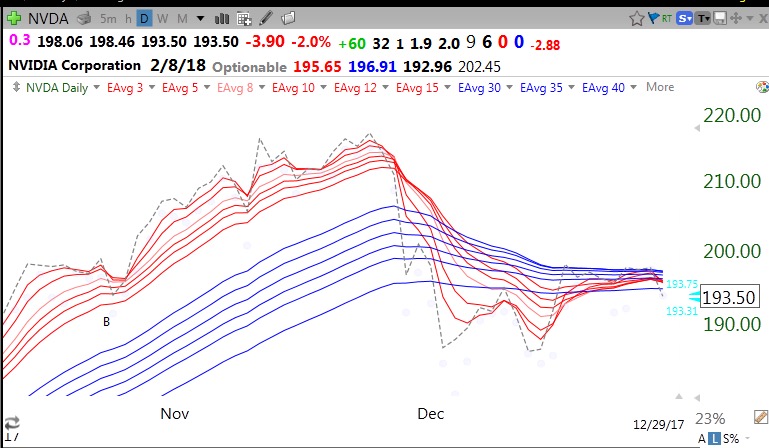
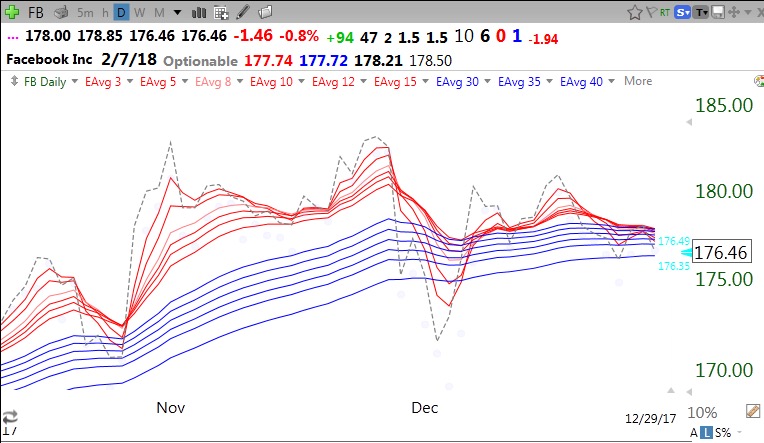
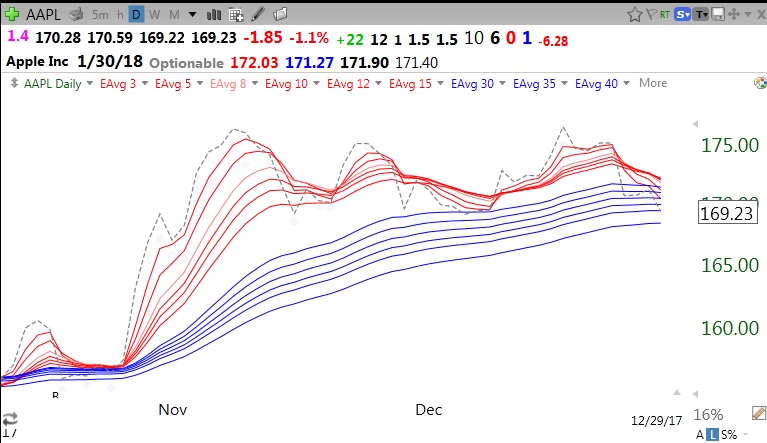
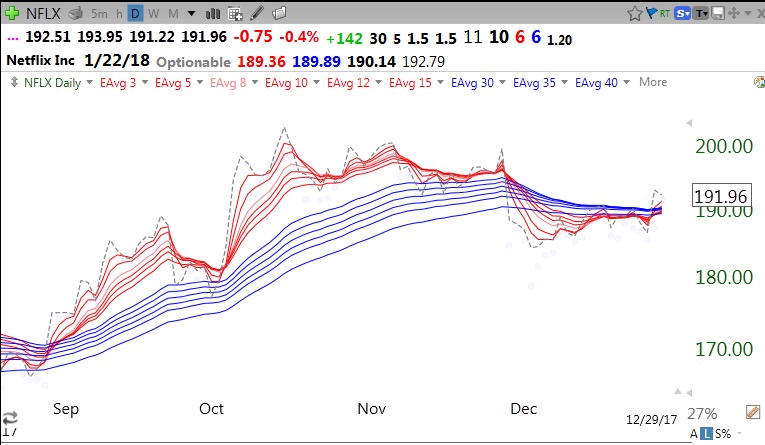
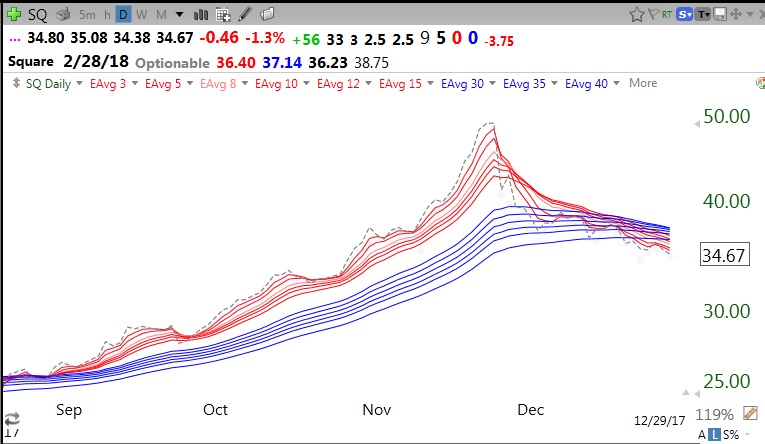
AMZN and GOOGL are holding up better (into shown). But are the others forming their bull market tops? Also, is SQ hibernating or topping?
I don’t wait around holding declining stocks. Buy and hope is not my style. Once a stock closes 2 days below its red lines I like to exit. As the great William O’Neil has written, all stocks are bad, unless they are rising.
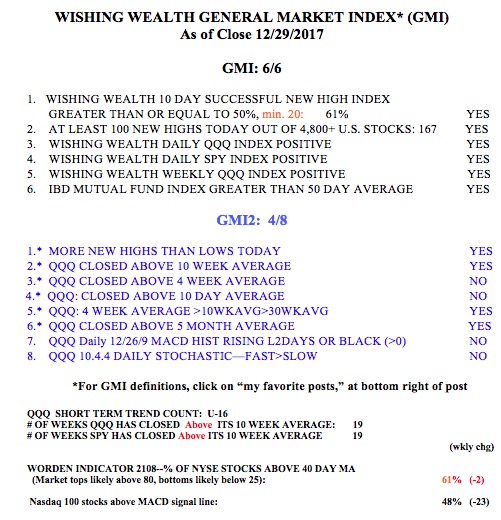
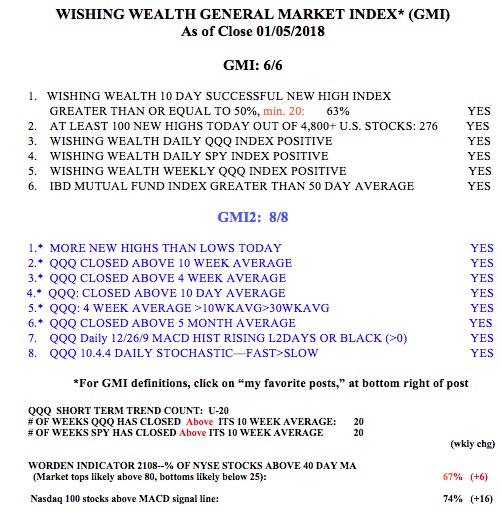
Meanwhile the GMI is at 6 (of 6) but the more sensitive GMI-2 is getting weak, at 4 (of 8). The QQQ is trending down and has not yet reached the area of technical weakness where it typically bounces.