During my 50 years of investing/trading I have learned that when my account grows suddenly very quickly and when many people tell me they are making money in the market (I see this now in tweets and chat rooms), the market often rests or tops. I sense we are at a time like this and I am holding on only for the end of the quarter mutual fund window dressing period to be over before I reduce my holdings. Too many speculative stocks, especially recent IPOs, are quickly doubling (IQ, HUYA are examples). I was just mildly concerned, until I did the following analysis.
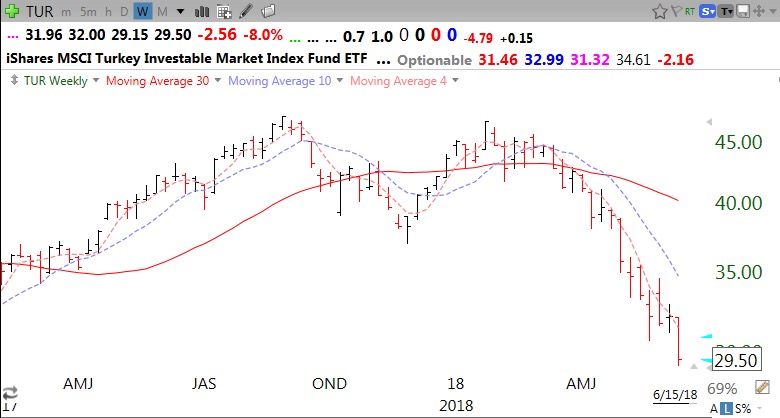
I have created a watchlist of 38 country market index ETFs across the world. I decided to look at them this weekend. I sorted them by whether each closed above its rising 30 week moving average. In the past, anytime the SPY closed below a declining 30 week average I went to cash and was minimally impacted by the ensuing bear markets of 2000 and 2008. I was very surprised and concerned to find that only 6 of the 38 (16%) markets passed this test: The U.S. was the strongest (SPY), along with Qatar (QAT), United Kingdom (EWU), France (EWQ), Israel (EIS), and Ireland (EIRL). The remaining 84% failed my test. Some looked particularly weak to me: Russia (RUSL), Mexico (EWW), Italy (EWI), Thailand (THD), Turkey (TUR), South Korea (EWY), South Africa (EZA), Singapore (EWS), Brazil (EWZ), India (IFN). But Canada (EWC), Germany (EWG) and China (FXI) may also be topping.
Check out Turkey as an extreme example of a Stage IV down-trend. (solid red line= 30 week average)
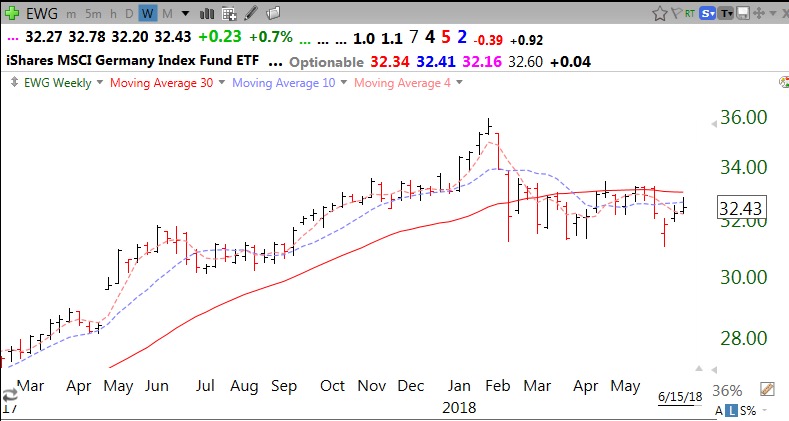
And Germany, which may be topping.
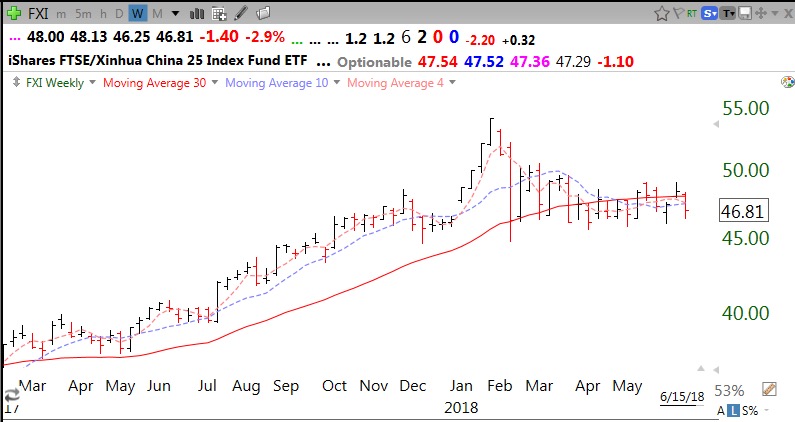
And China
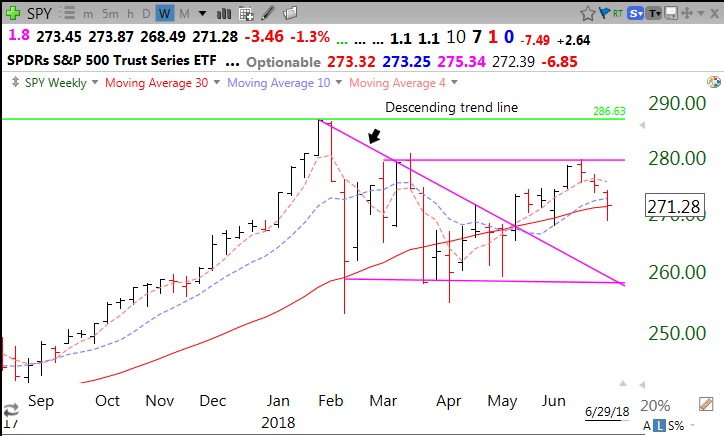
Compared with the U.S. (A close of the SPY back below its 30 week average would get me into 100% cash.)
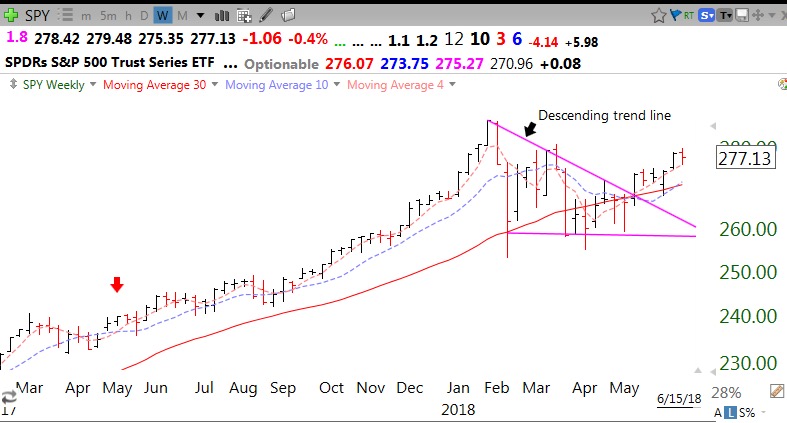
With the U.S. now raising costs (by tariffs) for a lot of imported goods, it looks to me like the rest of the world may be heading for a recession, or worse. How long can the U.S. market diverge?
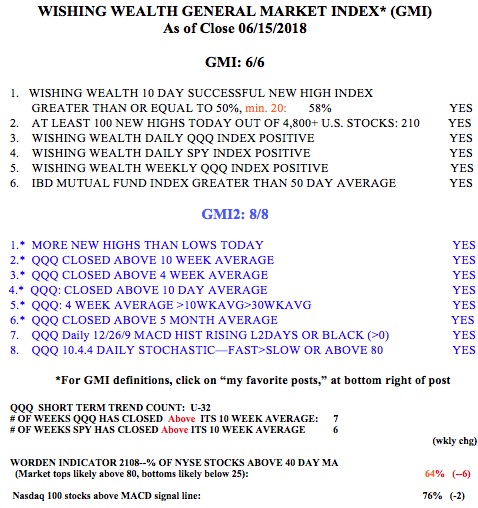
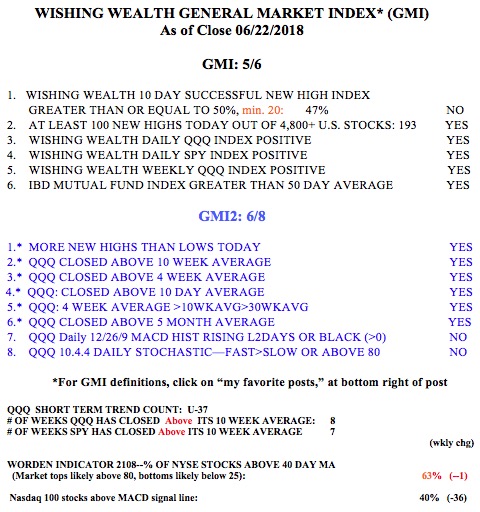
The GMI remains strong at 6 (of 6) and Green–for now.