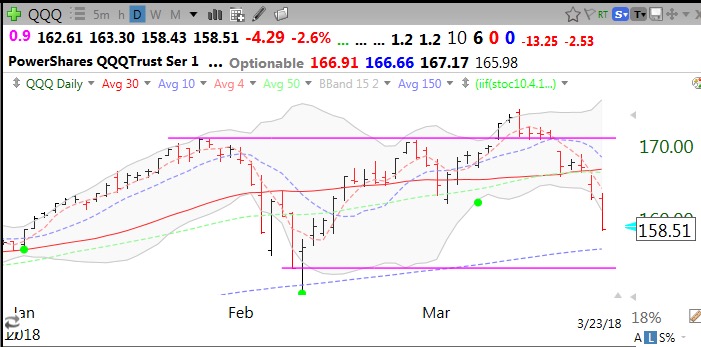
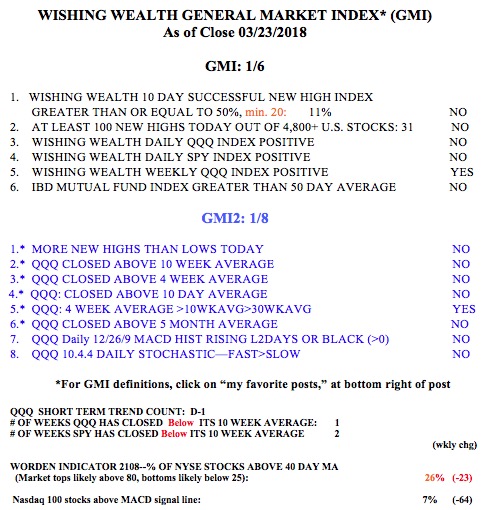
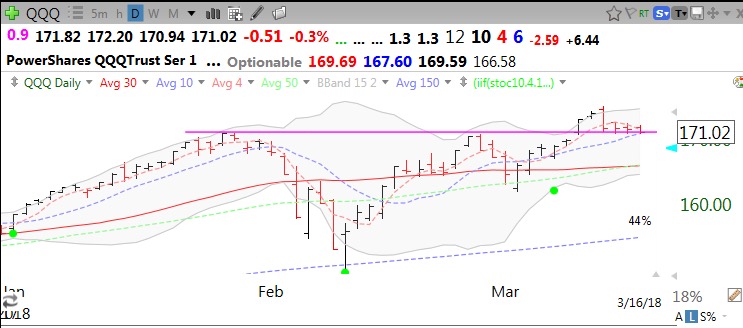
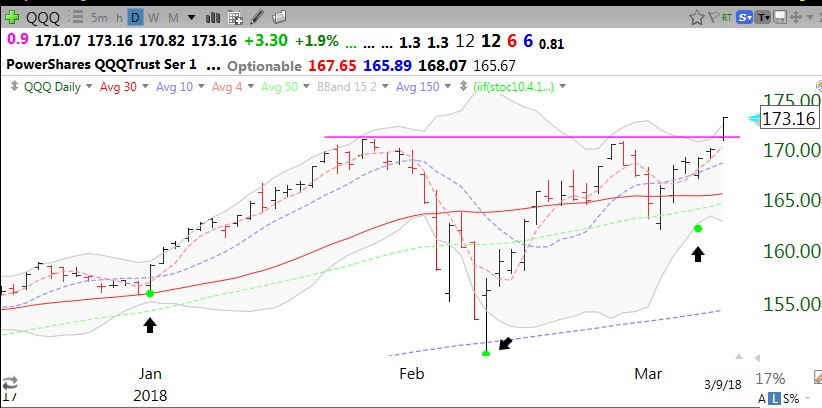
The technicals for the major indexes are pretty weak even though tonight’s futures indicate an up opening on Monday. Friday was the first day of a new QQQ short term down-trend. About 40% of these short term down-trends last under 5 days. This is a good time for me to retreat to cash in my trading accounts. However, the put/call ratio on Friday was 1.25, about as high as it gets. This means that many more put than call options were traded–relatively more traders were betting on a decline or buying insurance for their holdings. This is a contrarian indicator–extreme bearishness tends to precede a short term bounce up in the markets. Another contrarian indicator, the Worden T2108 is at 26% but it reached a more extreme 8.6% during the February decline. A T2108 below 10% is a really good sign for me of an oversold market. Finally, the 10.4 daily stochastics indicator is at 9, a level at which the market indexes I monitor tend to bounce. The QQQ has advanced in only 2 of the last 10 days. This daily chart shows the QQQ’s recent failed break-out and subsequent decline. Re-test of the February lows coming?
With the end of quarter coming this week, we may see some mutual fund window dressing and a respite from this decline. We could then subsequently see a rise into earnings in mid-April, leading to the “Sell in May and go away and come back at Halloween” maxim. This strategy may actually work this year, or it may not. Either way, it appears to me that the multi-year bullishness we witnessed since 2016 (2009?) has dissipated. It amuses me when media pundits say there is no problem for stocks now because the economy still looks fine. The market always discounts the future. There were very few media bulls in 2009 when the market bottomed and began to move up. There will be few media bears at the top……..
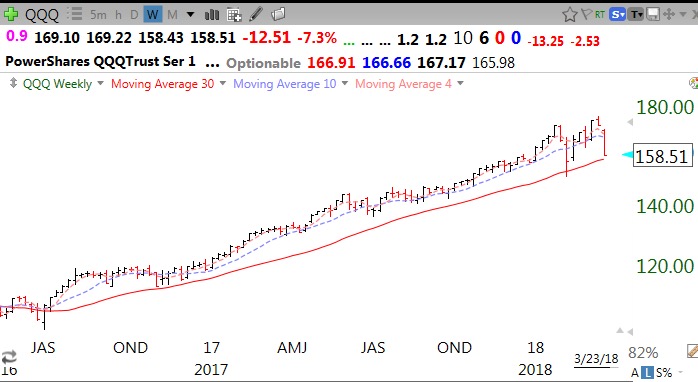
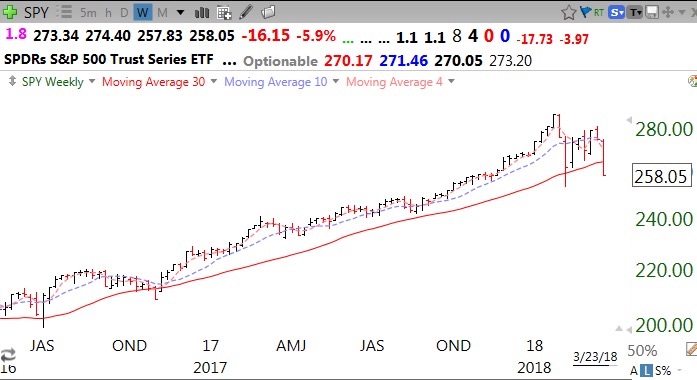
I have not transferred from mutual funds into money market funds in my university pension— yet. I typically do so when the market indexes enter a Weinstein Stage IV decline. That has not happened yet. If it does, it might signal the beginning, not the end, of a major decline. It is troublesome to me that the DIA and SPY have closed below their critical 30 week averages for the first time since 2016. The QQQ remains above its 30 week average but is heading down towards it. The 30 week average is the solid red line in this chart.
In comparison, here is the SPY. The SPY may be leading the techs down. The market may be getting ready to slaughter the multitude who were told to seek refuge in this “safe” market ETF.
When the 30 week average for the QQQ curves down, it is a sign for me to exit the market even in my university pension. That signal got me out before the 2000 and 2008 market debacles. I am a chicken and would rather retreat and reinvest later when the 30 week average turns up. Trend followers rarely exit/enter at the exact top or bottom. We follow the trend.
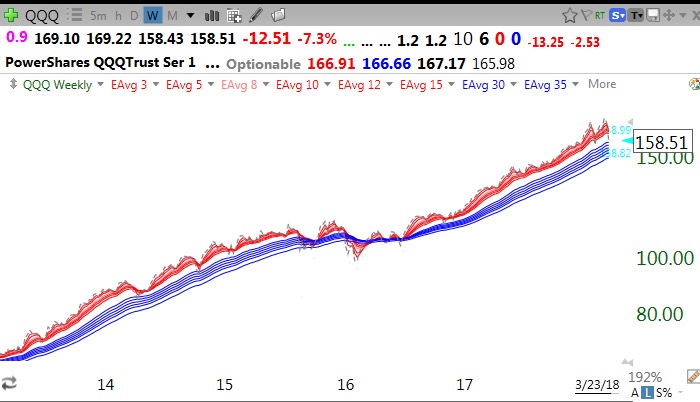
This weekly Guppy chart shows the market was in a strong RWB up-trend (see glossary) for most of the time since 2013. There was a period in 2015/2016 when the market leveled off and the white band in the middle disappeared. Perhaps we are entering such a period. With the strong advance we had since 2016, we got spoiled and it is easy to forget that the market can go sideways (or down) for many months. Perhaps we will enter such a period again.
The truth is that no one knows how long this decline will continue. It is up to all of us to analyze our tolerance for risk and to protect our capital. Contrary to popular advice, I do not have to remain in the market at all times. I am a boomer, too close to retirement.
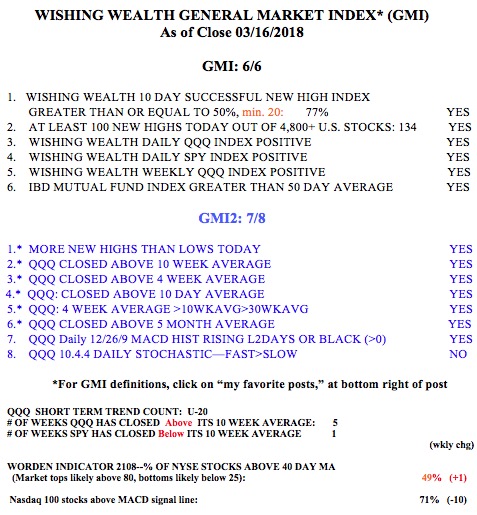
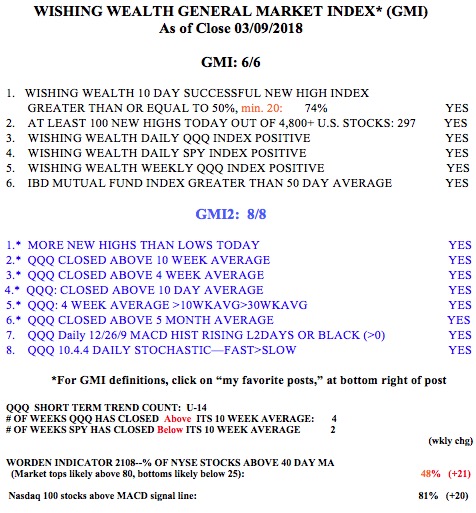
Meanwhile, the GMI (see glossary) is now down to 1 (of 6) and has flashed a Red signal. The Red signal can sometimes occur at a brief market bottom of a decline or at the beginning of a long term down-trend. Time will tell.
