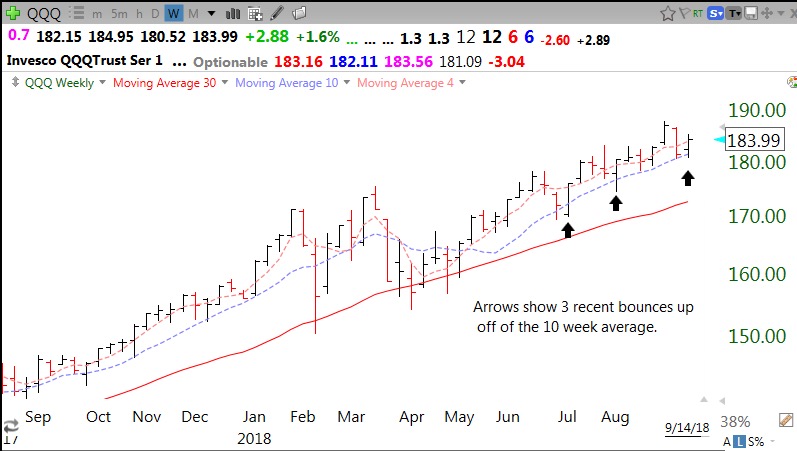
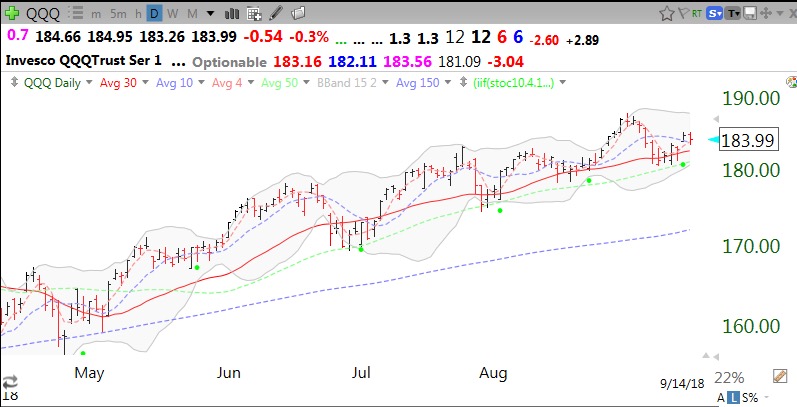
I focus a lot of my attention on figuring out the trend of the market as measured by the Nasdaq 100 ETF, QQQ. If the QQQ is in an up-trend I can more often make profitable trades by buying IBD type growth stocks. This weekly chart of the QQQ shows that it has been in a nice up-trend since May, with the 4 week moving average of price (pink dotted line) rising above the rising 10 week average (blue dotted) which is rising above the rising 30 week average (solid red). This is a classic Stage II up-trend. Of note, is that the QQQ last week bounced off of its 10 week average, a key support level. A preferred place for me to buy index ETFs and individual stocks is when such a bounce occurs in an up-trend, as defined above. If I purchase on a bounce, my exit level for my initial stop is just below the low of the week of the bounce. My free Houston TC2000 webinar from 2012, available on this site at the webinars tab, provides a 2 hour tutorial on this strategy.
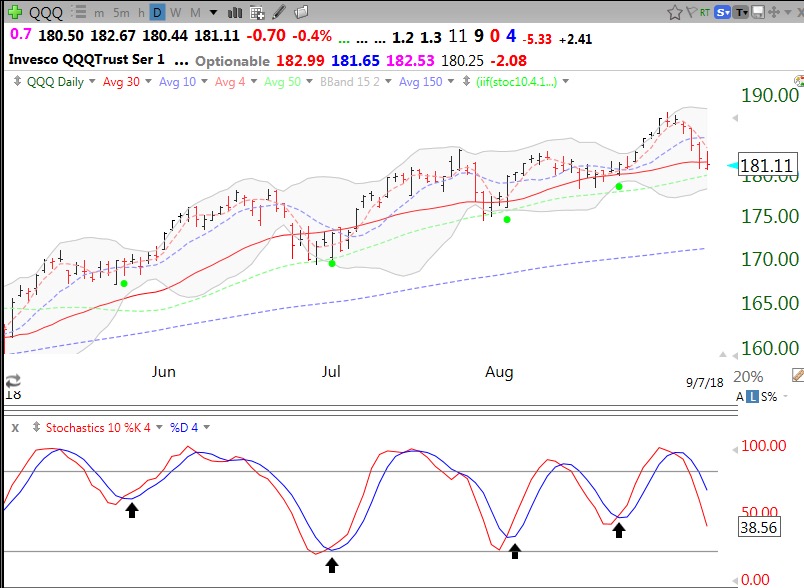
By concentrating on the weekly chart, I can avoid the noise and whip-saws evident in a daily chart. On the other hand, a daily chart allows a finer place to set entries and stops. Note the green dot signals in this daily chart of the QQQ. You can learn more about my green dot signals in my posts from last week or in my tutorial at my TC2000 club.
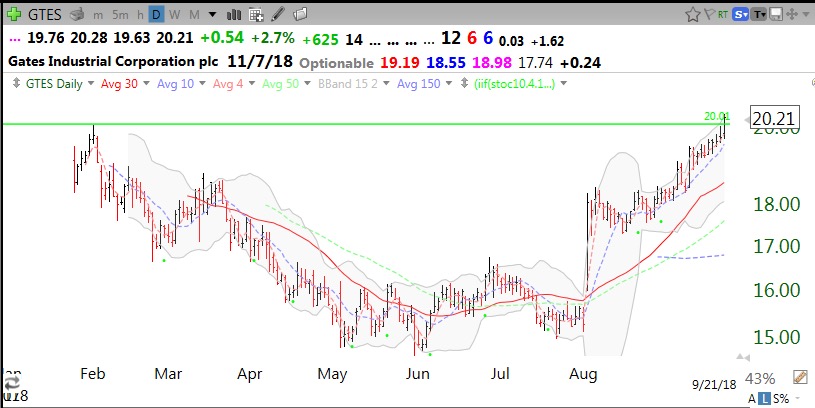
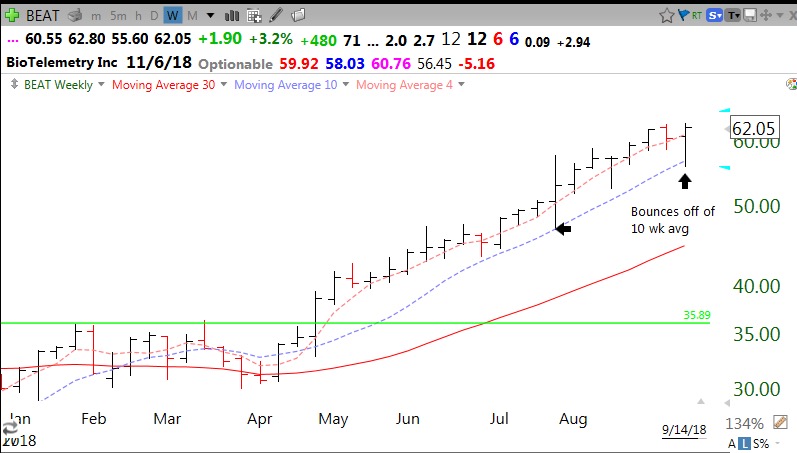
Beat is an example of a stock that bounced again off of its 10 week average last week. It had a green line break-out (GLB) in late April and has doubled from a year ago. If I bought BEAT now, my stop would be at last week’s low, about 55.59. If it holds, I can add more at each subsequent bounce off of the 10 week average and/or move my stop up. Weekly chart:
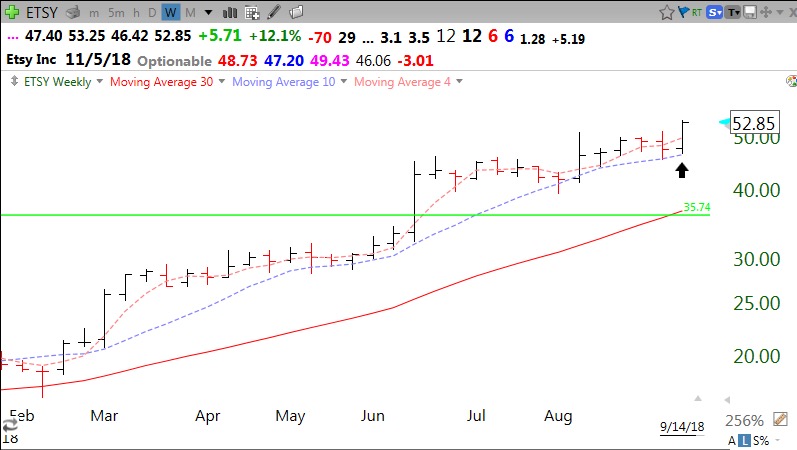
ETSY is another recent GLB stock that found support at the 10 week average last week:
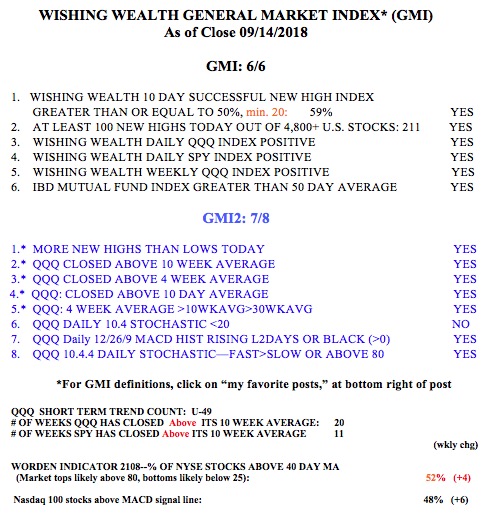
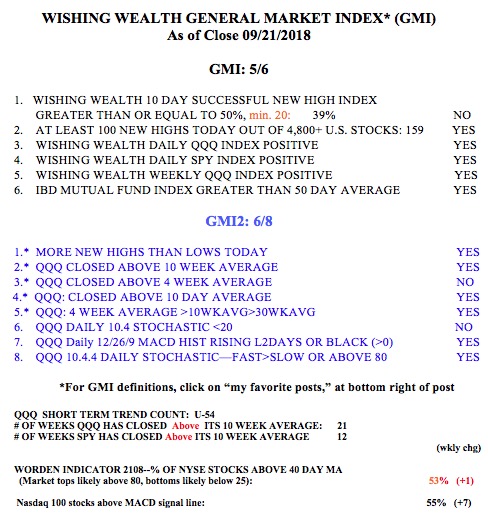
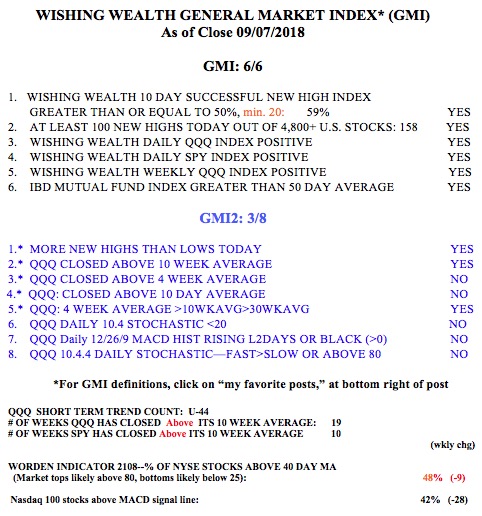
The GMI remains at 6, of 6, indicating an up-trend in the QQQ.