Happy New Year to all!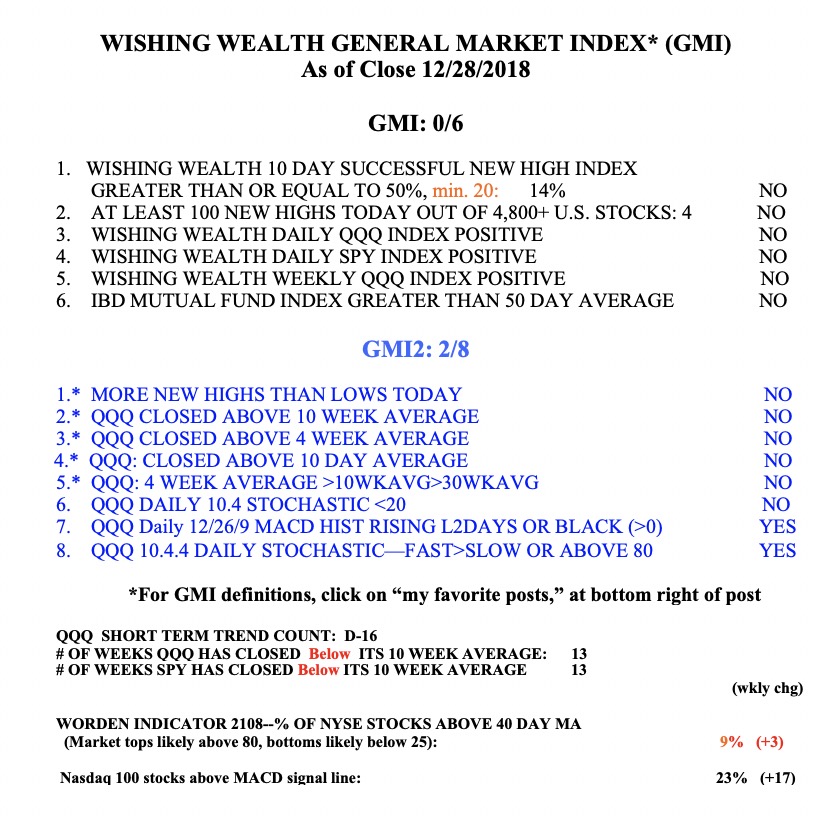
General Market Index (GMI) table
Time for cash
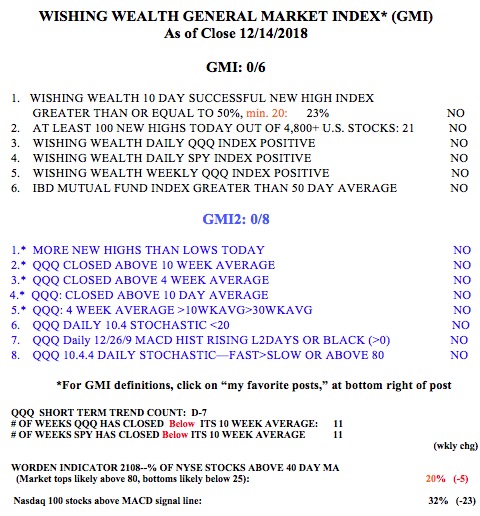
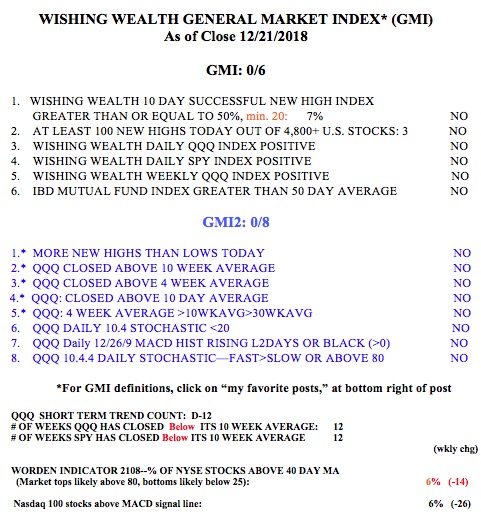
The market remains incredibly oversold. However, with the GMI at 0 (of 6) and still on a Red signal, it is time for me to remain in cash.There are few times since its inception in 1986 that the Worden T2108 has been below 6%. It closed Friday at 5.65%. Only 62 US stocks (of 4929) have a daily and weekly RWB chart pattern (see glossary for definitions). That is a ghastly statistic!
Stage IV decline imminent–in cash
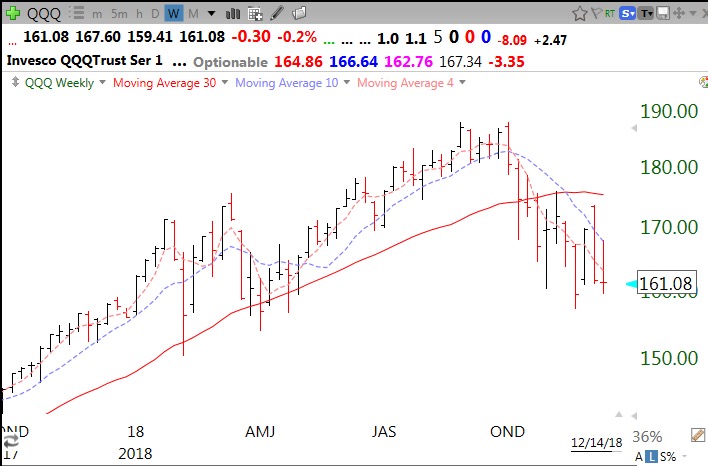
In 2000 and 2008 I went to cash in all of my accounts and avoided the market carnage. The major signal that I followed was the curving down of the 30 week moving average of the QQQ. This time I have been in cash earlier because I am more conservative as I approach retirement. I know its seems counterintuitive, but the QQQ now appears to be entering a Weinstein Stage IV decline. If this is true, the down-trend is just beginning. The only thing to get me back into this market on the long side would be if the indexes can close back above their 30 week averages and the averages begin to rise. This strategy has worked great for me.
On Friday there were 21 new highs and 763 new lows in my US stock universe of over 4900 stocks. With odds like that, why try to buy stocks at new highs hoping that they continue higher? ? The best tactic of late has been shorting stocks that are trading at new lows.
All 6 of my GMI and 8 of my GMI2 indicators are negative.