$AAOI and $INGN get hit, beware September/October

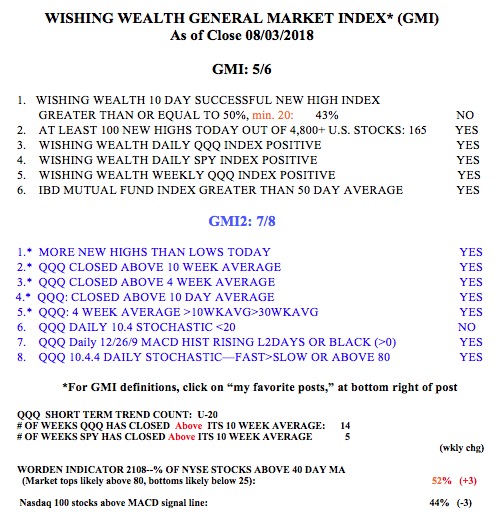
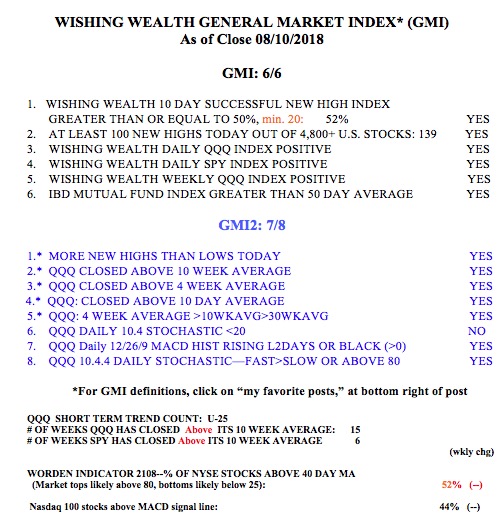
GMI5/6
GMI-25/9
T210852%

When you get la leading stock like AAOI suddenly collapsing it suggests to me that there are more air pockets that will burst.

And look at INGN

I know that the trend in the averages remains up. But with so many stocks collapsing as they announce earnings, I think that we will have a rough post earnings period coming up. September can be a cruel month for bulls. I remain in cash in my trading accounts but 100% invested in my university pension.

Warnings signs appear for the $QQQ; GLB: $BCO

GMI4/6
GMI-26/9
T210859%

While the GMI remains Green and the QQQ short term trend remains up (U-12, see table below), I am concerned by the lack of follow-through on a lot of GLBs (green line break-outs) recently and the number of high volume down days on the QQQ. Look at this daily chart of the QQQ. Most of the high volume days have been down days (red spikes).

These are what IBD calls distribution days. They can signal a top. And once earnings are out, we will enter the post-earnings lull when the market often weakens. I have seen a lot of declines in September/October. While I still hold some small long positions, I will run quickly if they falter. People have become complacent and now think that the market must always rise. I have been watching the markets since the 1960s and have seen repeatedly that the good times eventually end. The real winning traders are those who protect their accounts when the market declines.

Almost every stock that came up on my scans this weekend reports earnings this week. I will therefore not list them. Here is one stock that reported good earnings last week that is flying high on marihuana and had a GLB (breaking its 2008 peak). While TC2000 sent me my programmed alert of this GLB  after Wednesday’s open, I was away and missed the break-out. I think BCO is still worth watching now that it is smoking….

Wha a nice weekly yellowband advancing pattern! Is BCO too high or on a roll?

Here is the GMI table.


TC2000 Scan for bounce up off of support; $PETS unleashed? $CBOE yellowband

GMI6/6
GMI-28/9
T210864%

I created a new scan in TC2000 that looks for stocks that have bounced up off of 3 daily indicators of support/over-sold within the past few days. The stock must also have closed at least 50% above its lowest price of the last 250 days and be currently above $15. There are also other criteria in this scan. This scan of 4,800 U.S. stocks this weekend yielded 8 candidates: SRPT, INDB, ONCE, PETS, BATRA, ALNY, WEN, NCLH. Of all, I like PETS best. It had a high volume GLB to an all-time high (ATH) in May and has finally rested/consolidated. It has also doubled the past year and had a recent EPS +37% and an IBD Composite rating = 96 and RS= 98.

This weekly chart also shows a powerful rising yellowband pattern with the stock repeatedly closing above its 10 week average (dotted line) which is well above its rising 30 week average (red line).

Unfortunately, PETS reports earnings on Monday morning. Should have run this scan Friday afternoon. What to do?  Buy PETS a collar?!

ALNY, a bio-tech and a long time Judy favorite, also came up on this scan. But I have too many bio-techs already, and they are so volatile…If you would like to run this scan yourself and you have TC2000, I added it to my free club (Scan 07202017three…) which can be accessed at www.wishingwealthblog.com/club or at the link at the top of this blog…

I also manually looked at stocks that hit all-tme highs Friday or were close to a GLB. Here are some worthy of research:NRE,TBK,RGA,PODD,ELMD,EXPD,NDAQ,AAAP,ABBV,CSRA,AGO. When I noticed that NDAQ is on the list I looked at a weekly chart of CBOE. Note the strong rising yellowband pattern since its GLB in December. How did I miss this?

All of my GMI and GMI-2 indicators are positive. The earnings inspired rally has begun.