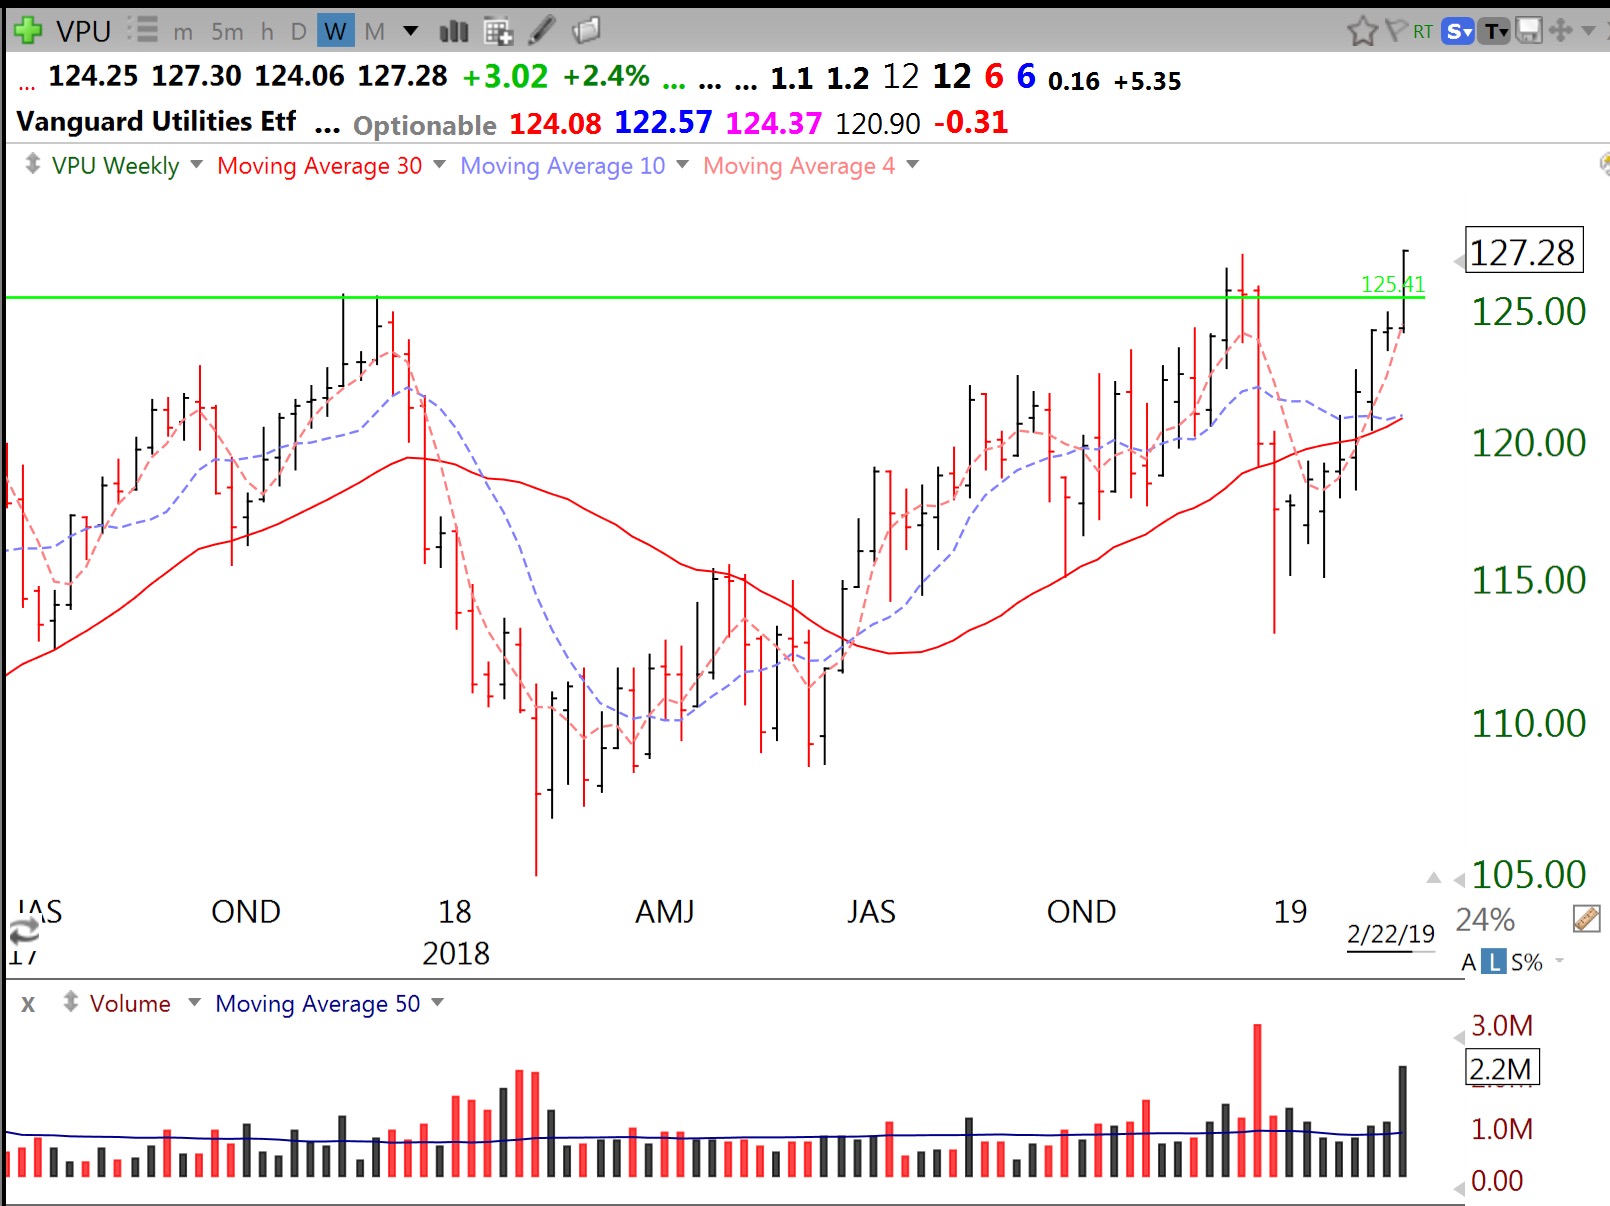
Dividend paying utilities are also back in favor. Weekly chart of ETF VPU shows GLB on above average volume.
Stock Market Technical Indicators & Analysis
Dividend paying utilities are also back in favor. Weekly chart of ETF VPU shows GLB on above average volume.
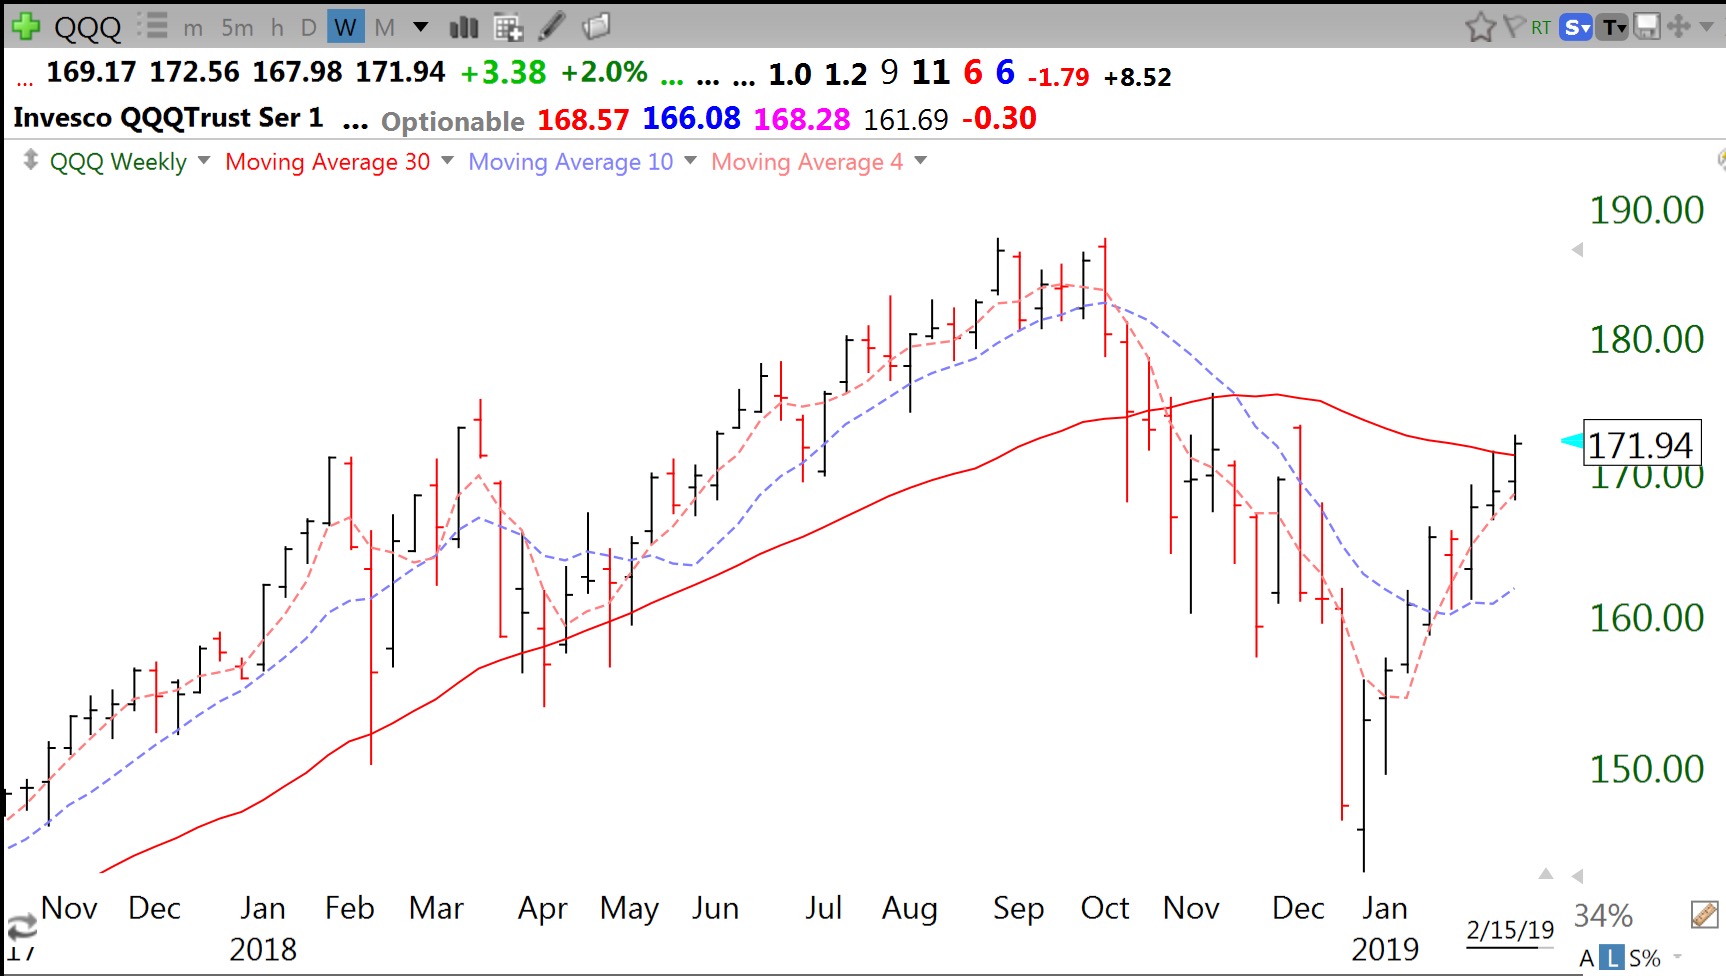
The major indexes I follow have closed back above their 30 week moving averages. The question remains whether they can move above their all-time highs. I prefer to see the 30 week average (red line) turn up. In the past, getting back into the market after the 30 week average has turned up has enabled me to catch the ensuing up-trend.
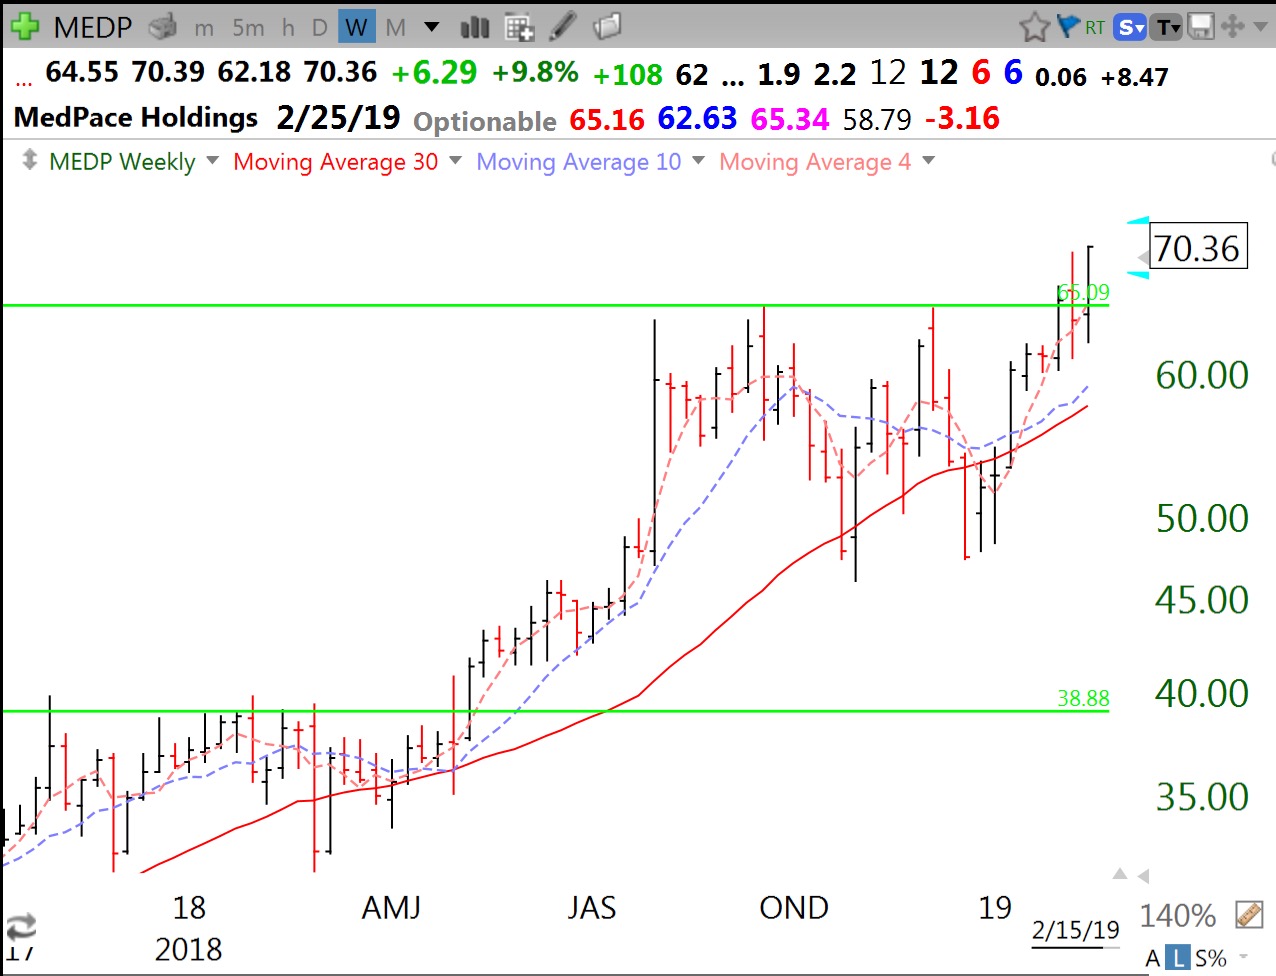
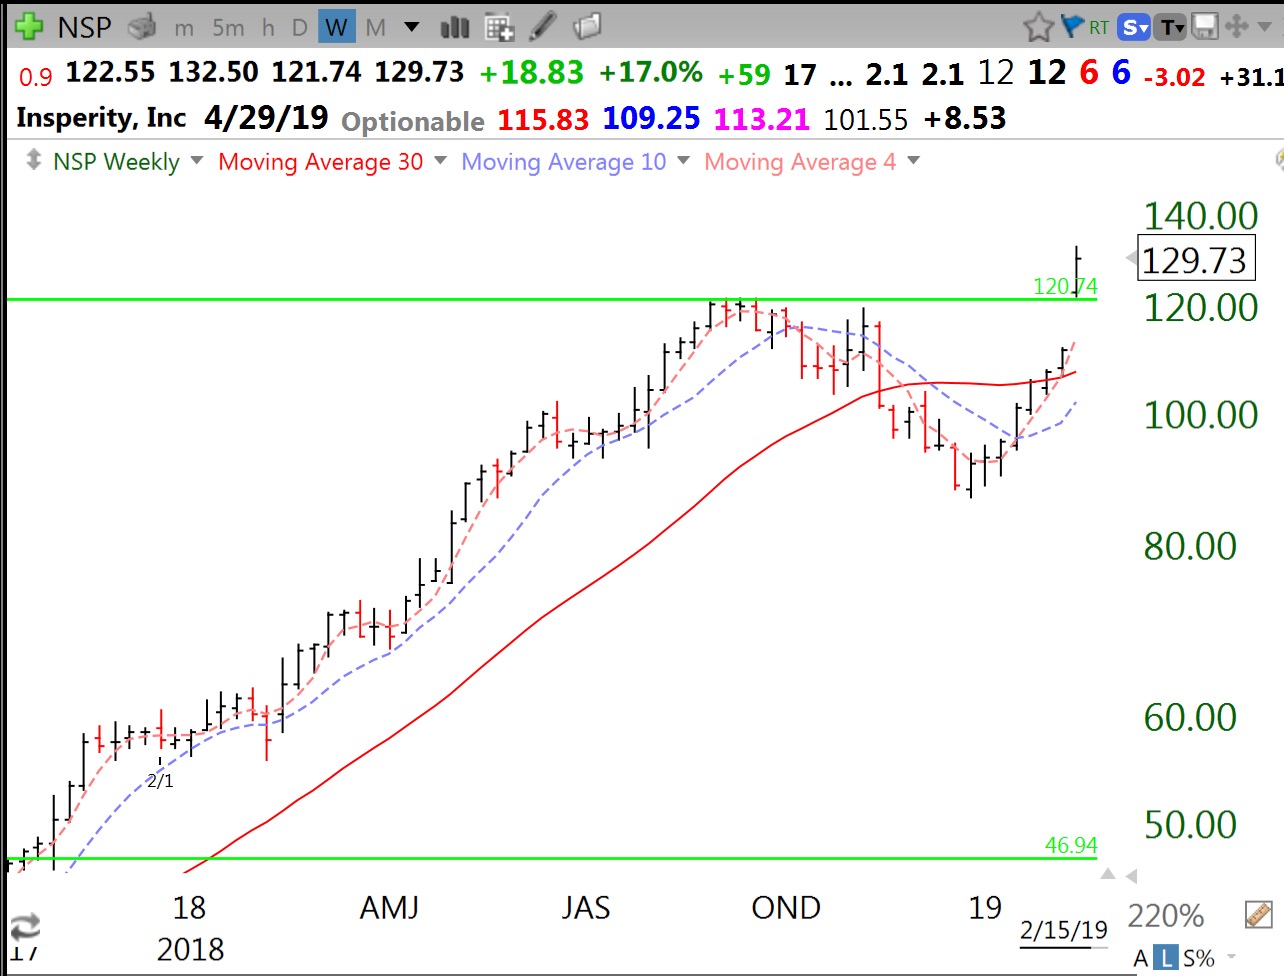
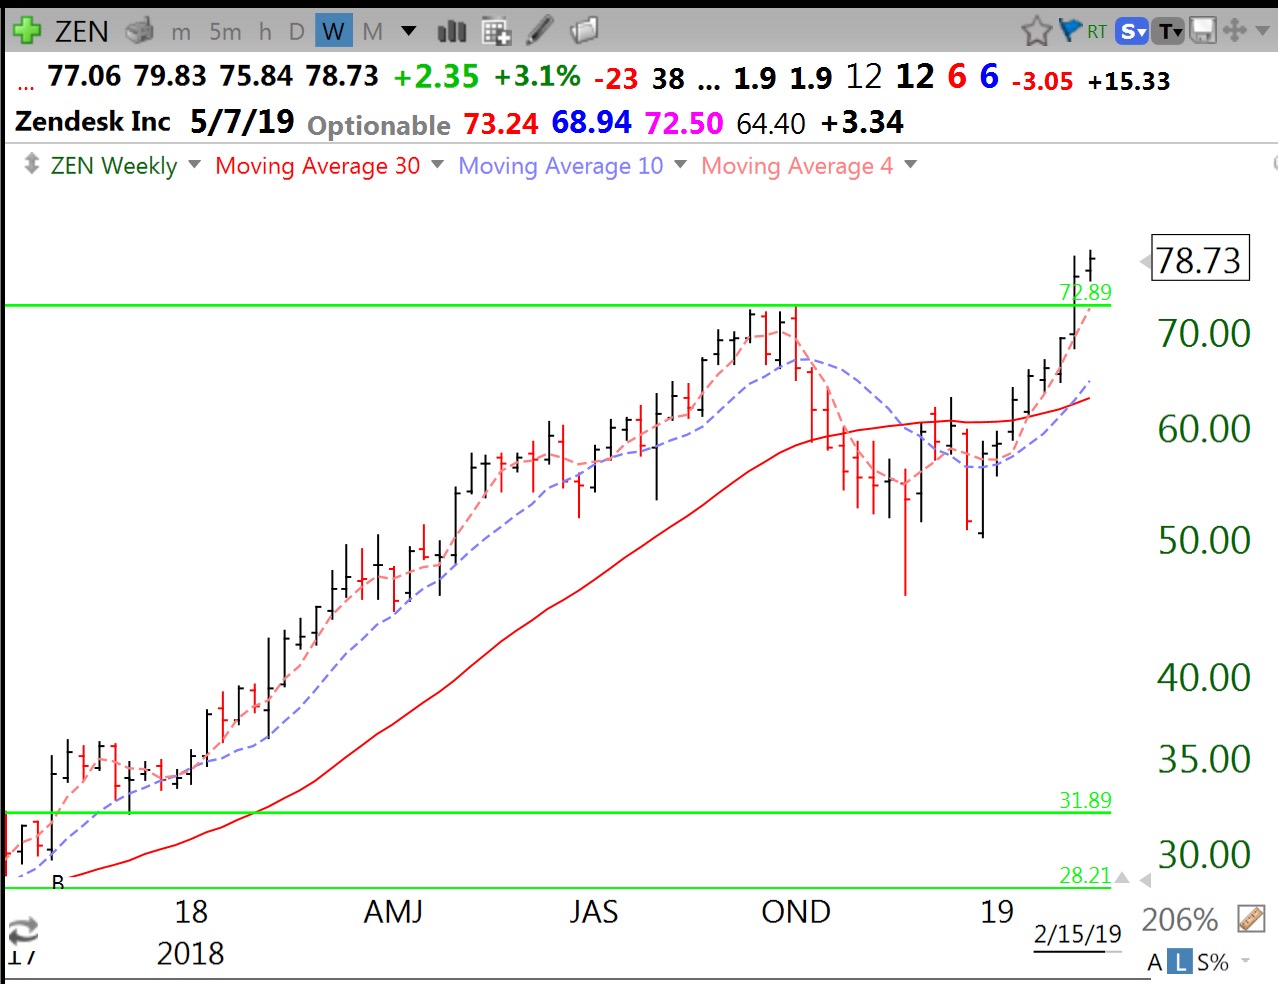
Three recent GLB stocks. ZEN broke out 2 weeks ago.
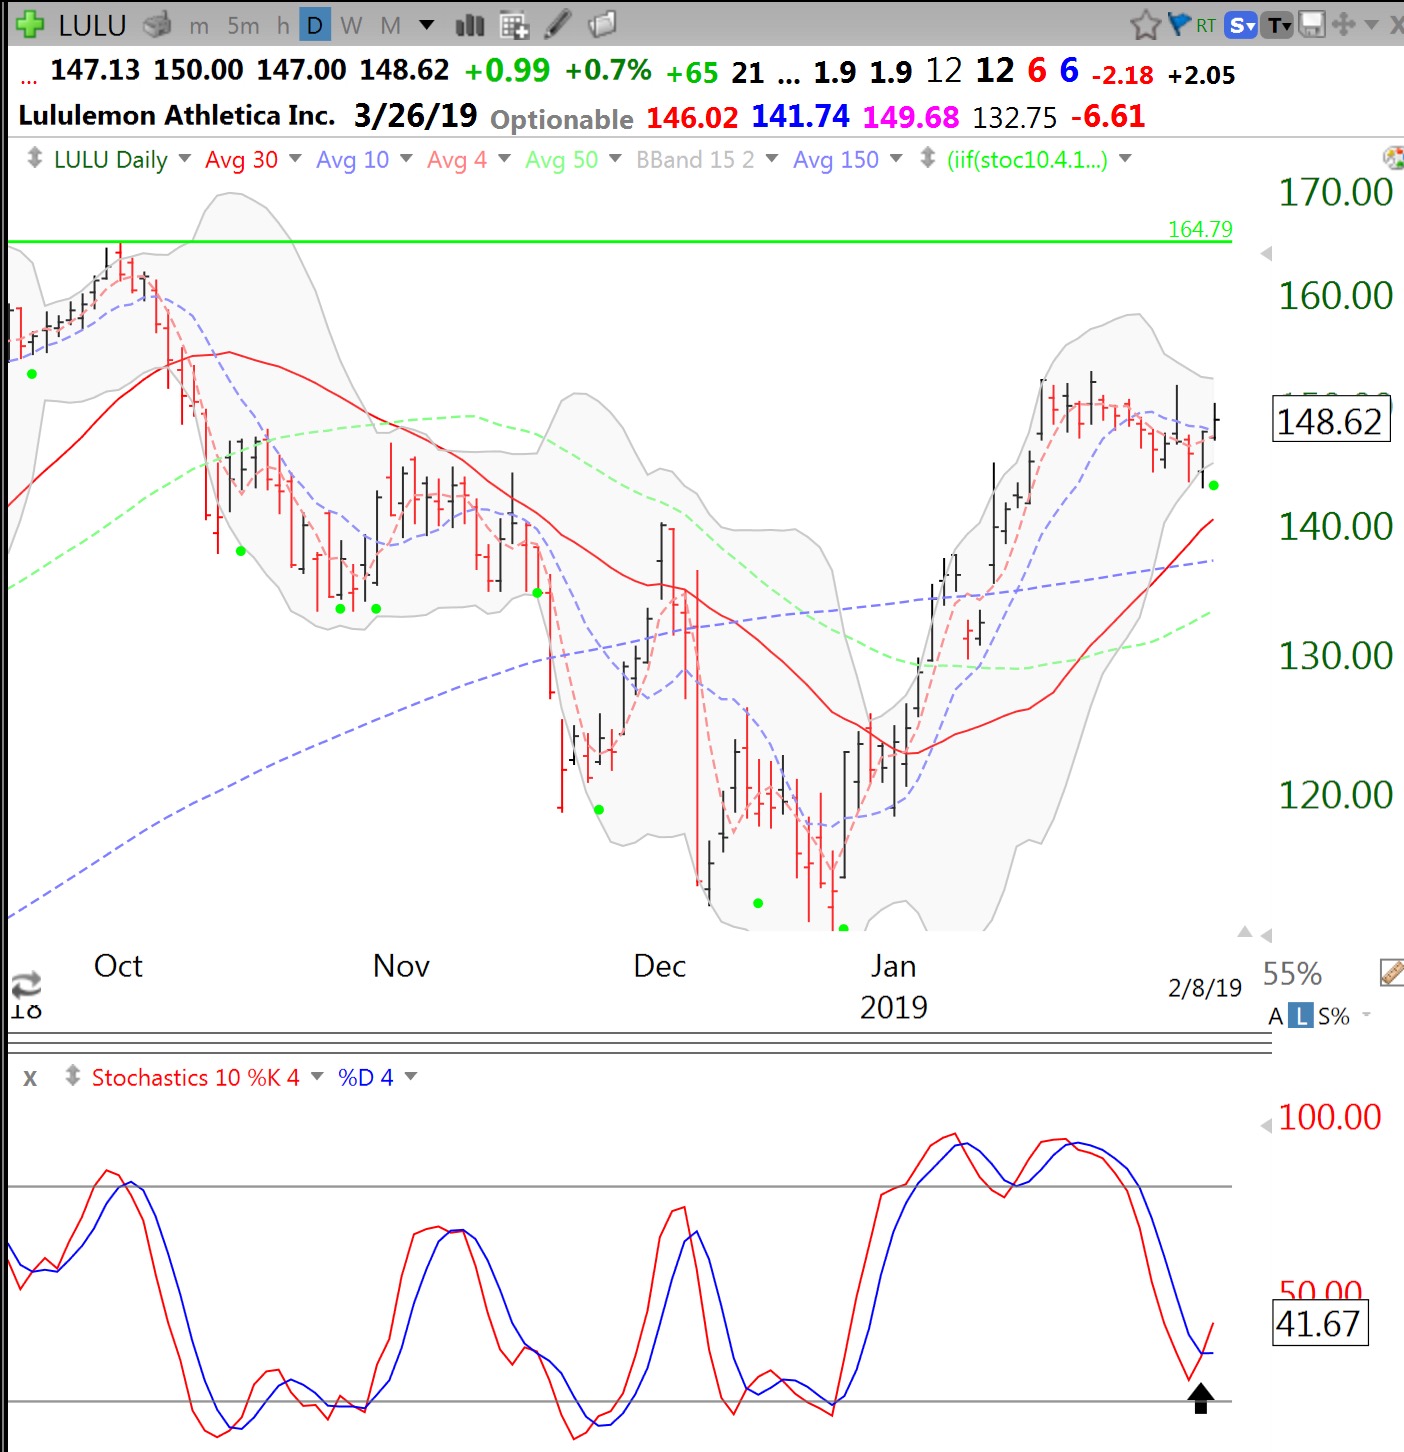
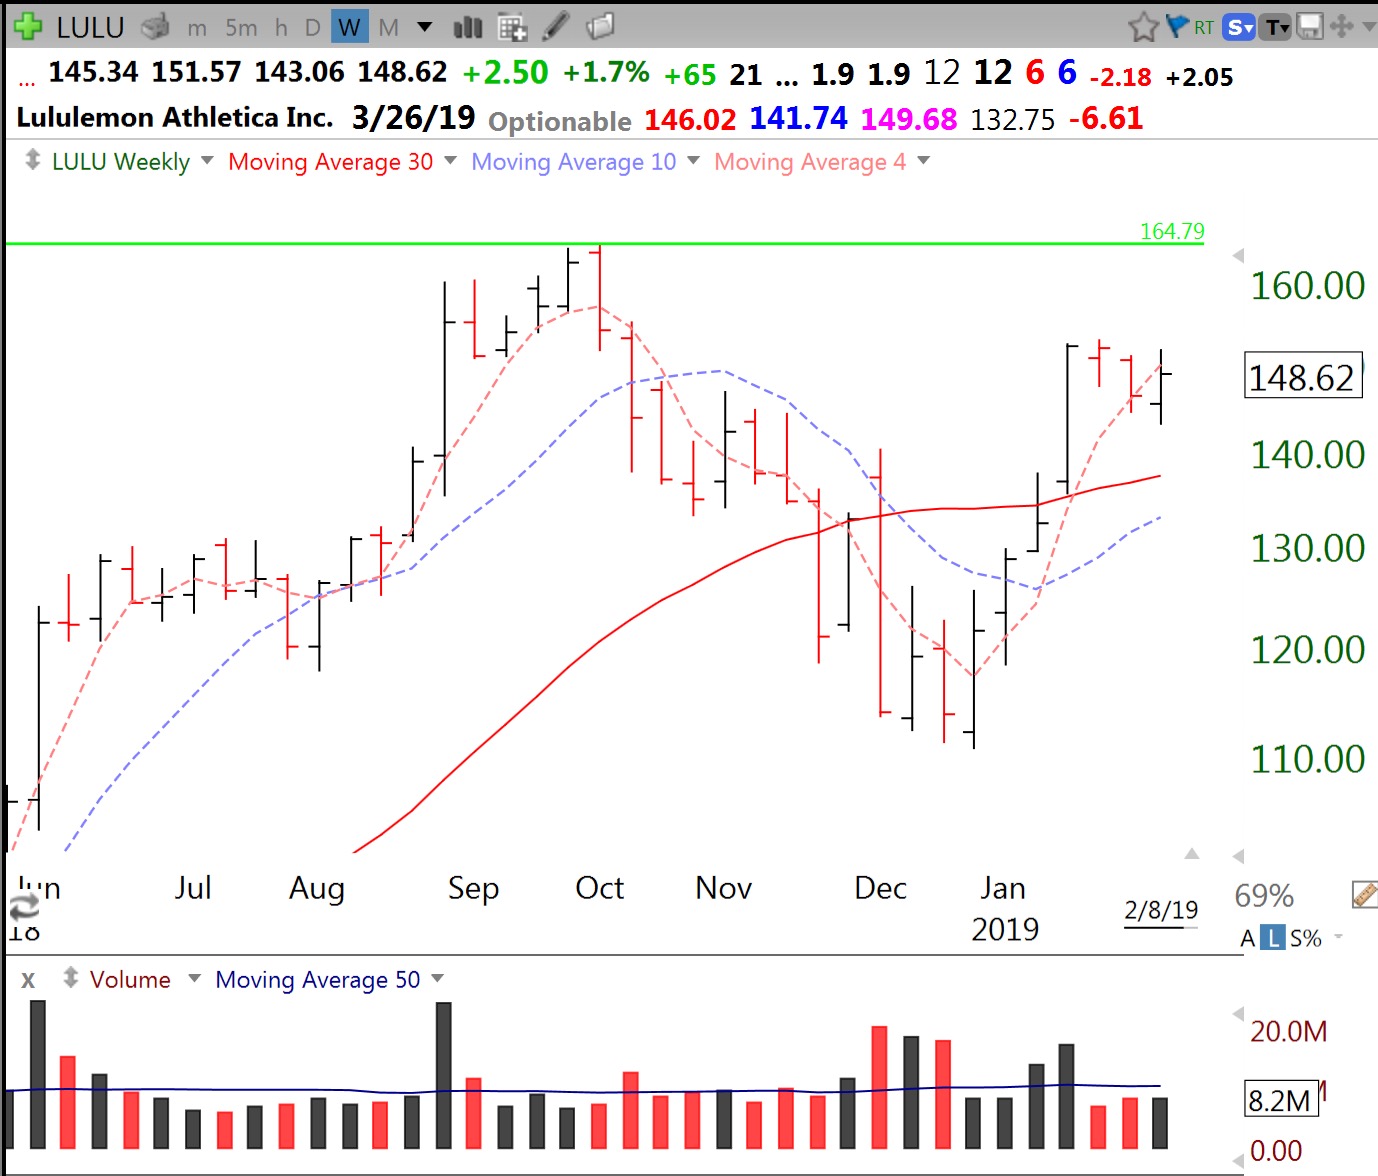
My readers know that one set-up I like is to buy a stock having a green dot signal. That signal involves an oversold fast stochastic crossing above a slow stochastic. Users of TC2000 can go to my club and view a video showing how to add green dots to their charts. LULU had a green dot on Friday, as shown on the daily chart below. Note the arrow below the price chart indicating the stochastic cross. A green dot signal indicates that a stock is bouncing from an oversold level. This signal is not often useful for a declining stock (see many recent failed bounces below). Before I act on a green dot signal I look at the weekly chart to see the trend and the stock’s position regarding its last green-line top. LULU is below its last green line peak (green line is drawn only after the ATH peak is not surpassed for at least 3 months). But the weekly chart shows a possible bullish cup with handle pattern. If I were to buy LULU I would place my stop loss below the low of the day of the bounce (143.06, also the weekly low here) at 142.99. I also like the fact that LULU has recently bounced up off of its lower 15.2 daily Bollinger Band. IBD strategists would likely wait for LULU to trade above its pivot (top of the handle, around 153) on above average volume, to go long.
Many green line break-outs (GLB) have been failing recently so this set-up may not work in such a technically hazardous market with few stocks hitting new highs. In a rising market with many successful break-outs to ATHs (all-time highs), I have found the green dot signal to work best for me. I prefer to buy bounces from support rather than the actual break-out because I can set my stop loss at a technically meaningful place where the possible loss is also minimal. It is much harder for me to know where to set a stop after a break-out so that it is both technically meaningful and minimizes the potential loss. My esteemed stock buddy and stock picker @TMLtrader tweeted about LULU on Friday. I urge my twitter followers (@Wishingwealth) to follow him.
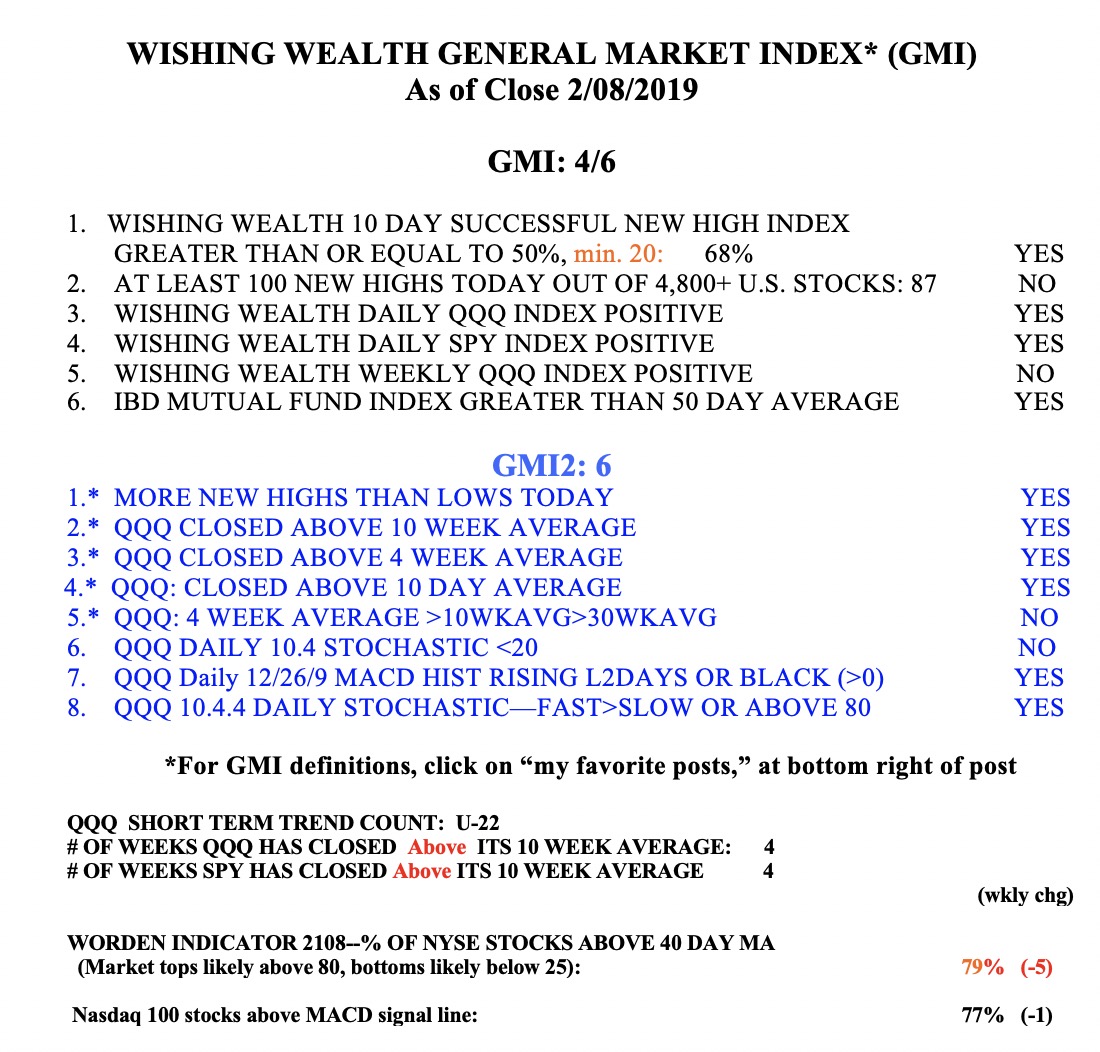
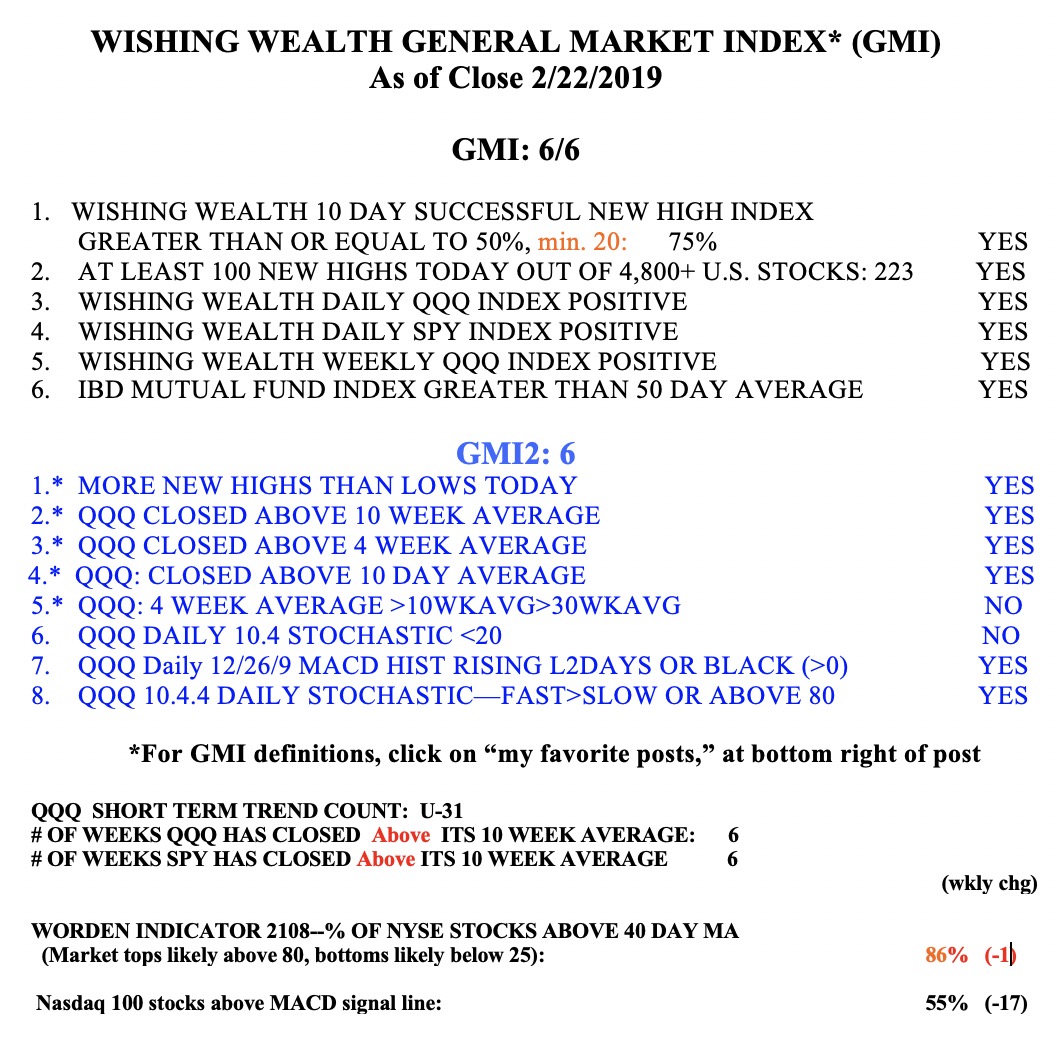
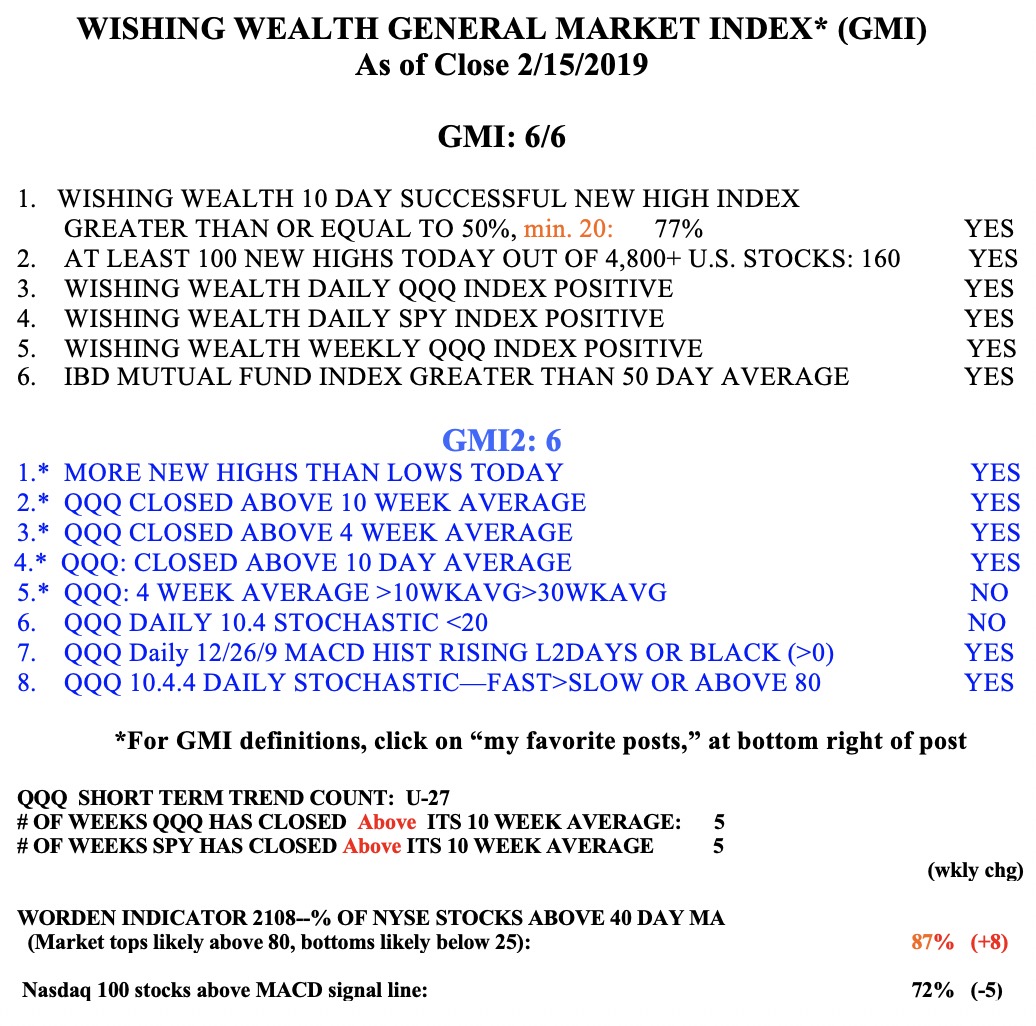
The GMI remains Green but the indexes are caught between their rising 4 week and falling 30 week averages. Something might give this week.