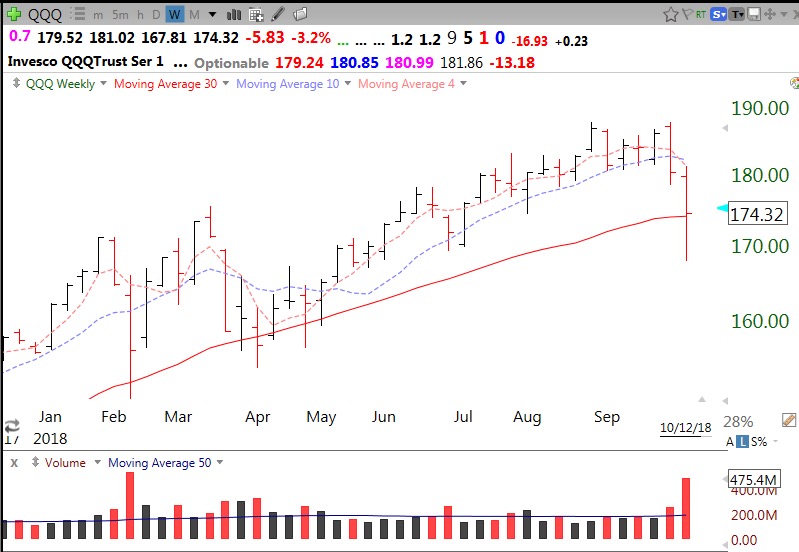
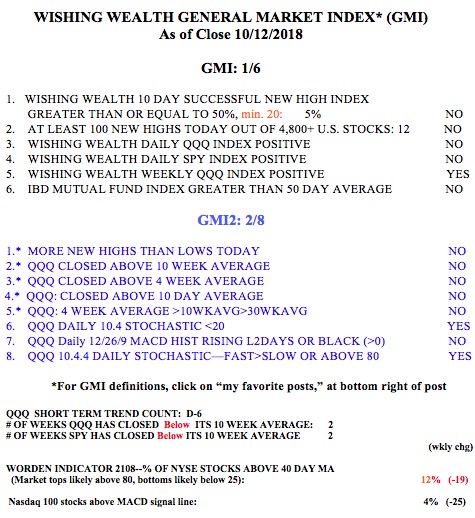
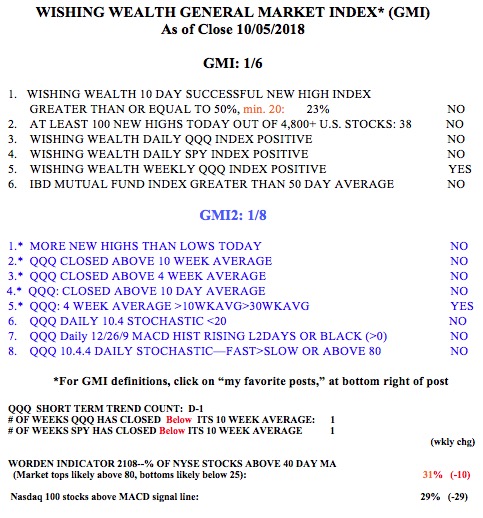
I attended the TC2000 workshop in Maryland during the weekend and learned many important things. By the way, the educator, Michael Thompson, was tremendous and I suggest you catch him at his next workshop. His upcoming free workshops are listed here.
Most important, within 30 days, TC2000 will run on a variety of platforms, including Macs and iPads! It will no longer be necessary to run a special program to run Windows on a Mac.
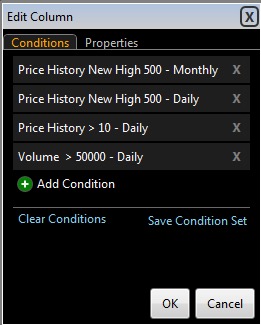
I also learned how to create a condition to find stocks at all-time highs. Simply use built-in variables that come with TC2000 to create the condition set below. My requirements of price>$10 and daily volume> 50,000 are my specs and differ from those used by Michael. The important thing to note is that one can create this condition set in a column (or scan) and use it to find all stocks in a watchlist that are hitting all-time highs during the trading day. One can then plot the stocks on a monthly chart, draw in the green line tops (an all-time high not surpassed for at least 3 months) and find stocks having a green line break-out (GLB) during the current day. A GLB with a high volume buzz (another stat available in TC2000 that shows whether volume when accessed during the day is above average for that time of day) can indicate a break-out with a lot of buying interest.
13 stocks met these criteria Friday: CME, CLX, CHD, UGI, ANTHM, LW, TNP.F, KZR, MKC, AWK, AWR, WEC, VVC. Any stock that can come through the recent market weakness at an all-time high must be worth my researching……
I also learned at the workshop that some persons find it difficult to access my TC2000 club, Dr. Wish. To access my club with its free scans and green dot video tutorial, you must go to www.wishingwealthblog.com/club and sign up. Once you enroll, you restart TC2000, go to the library tab on your page and my club should be visible. If not, contact support@TC2000.com.
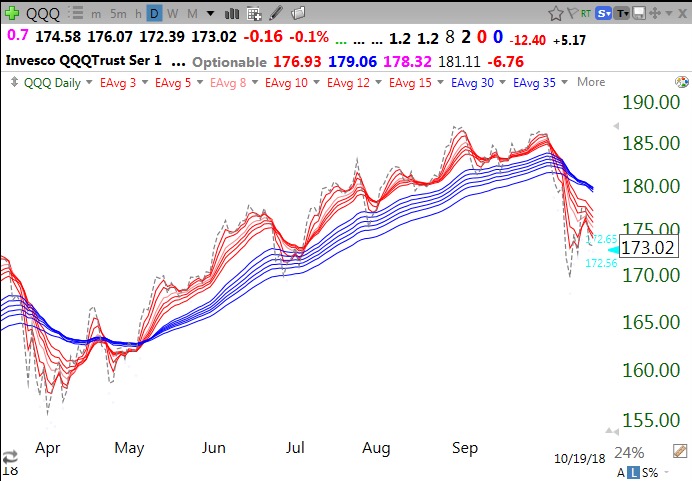
If you go to the Glossary tab at the top of my blog page, you will learn about the RWB and BWR patterns I like to follow. I am using here daily exponential averages, rather than the weekly averages discussed in the glossary. The daily averages show changes more quickly. For the first time since last April, QQQ is in a daily BWR down-trend with all 6 shorter term averages (red lines) declining well below the declining blue lines, such that there is a white space between them. This BWR pattern is a sign of weakness. Much better to be long when the index is in the opposite RWB pattern, which was mostly the case from May until October. The SPY is also in a similar daily BWR down-trend (not shown).
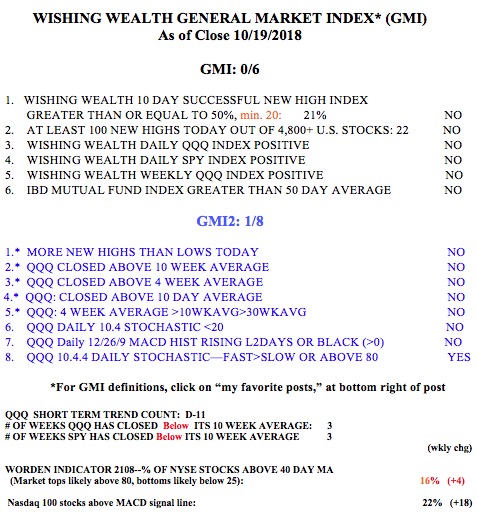
With the major indexes in daily BWR patterns and the GMI at 0/6 and on a Red signal, it makes sense to me to stay away from going long in this market. There will be plenty of time to go long once the GMI flashes Green and the RWB patterns return. I will post again Thursday evening.
