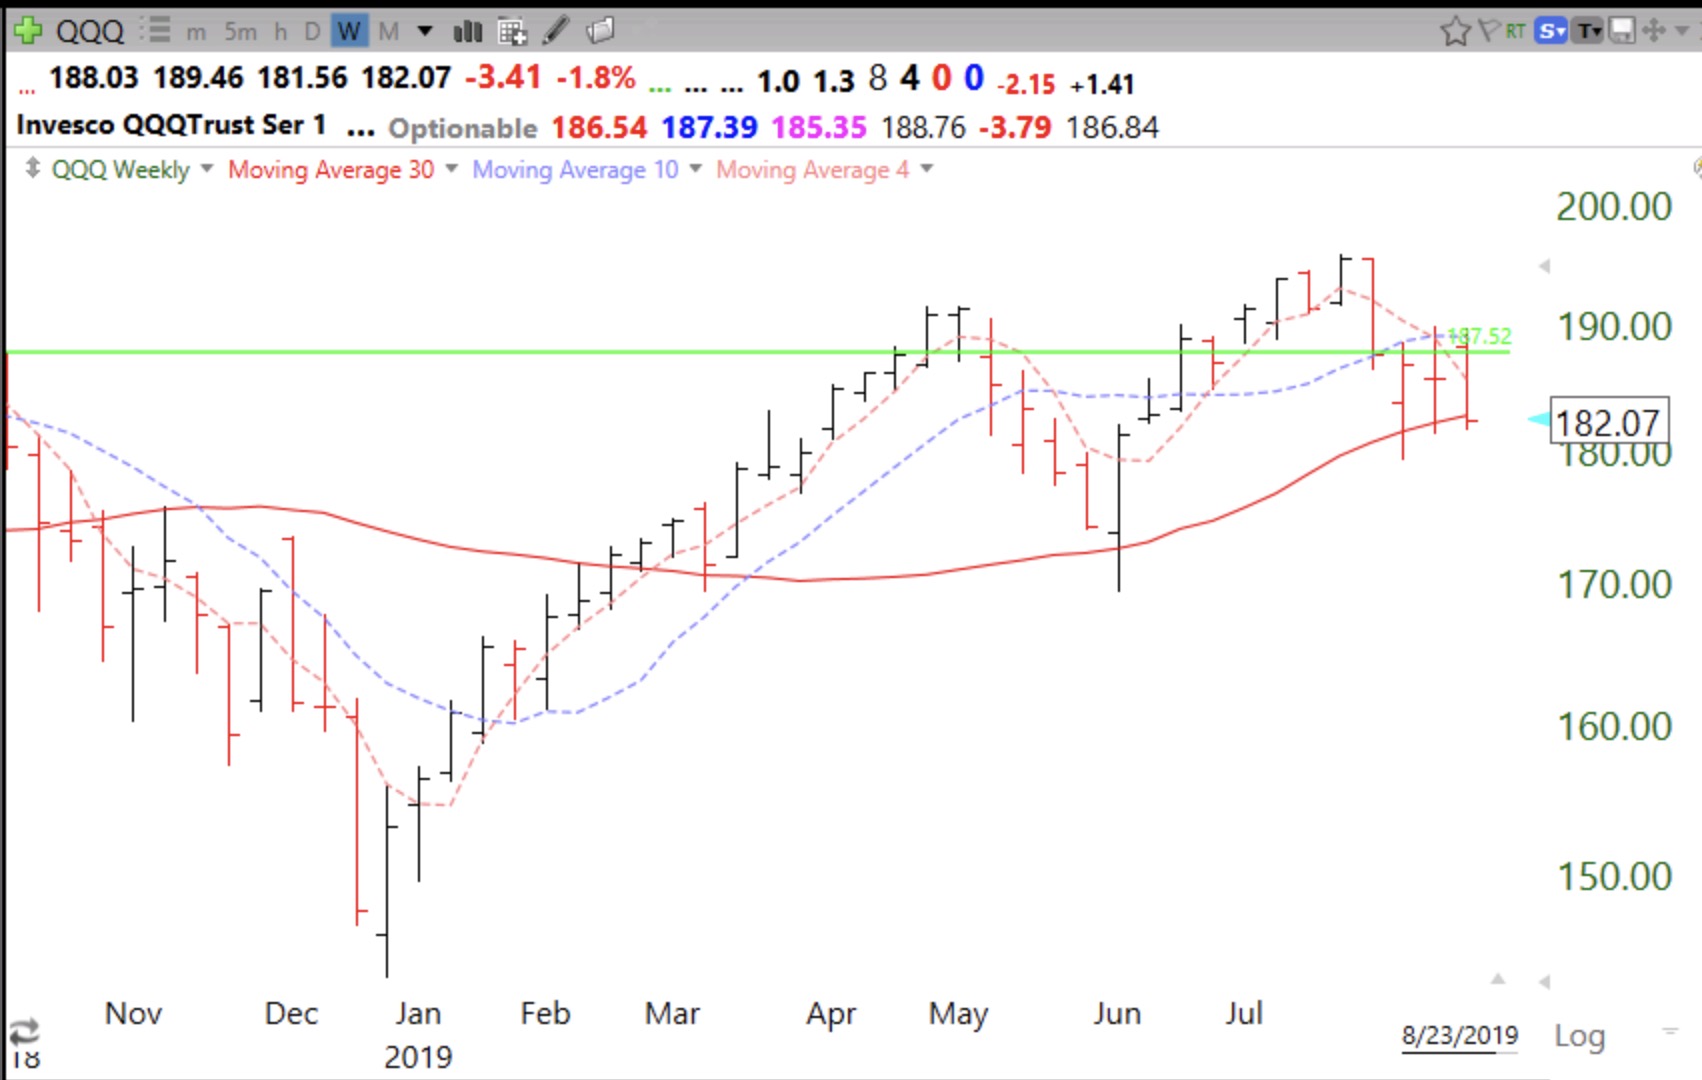
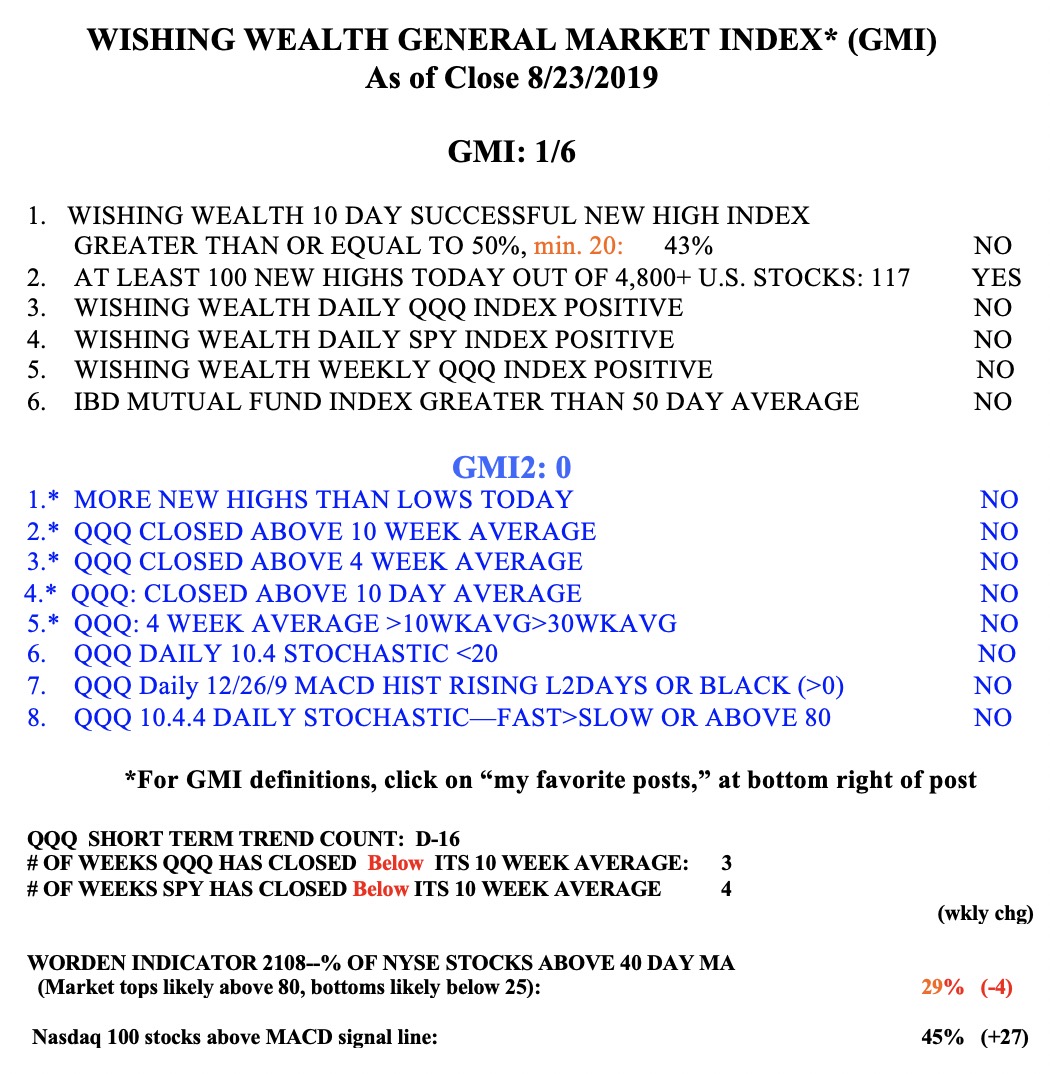
A set up I like is when a stocks breaks above its green line top (GLB) and on a weekly chart has just bounced up above its 10 week average. OLED is such an example. Dotted line= 10 week average.
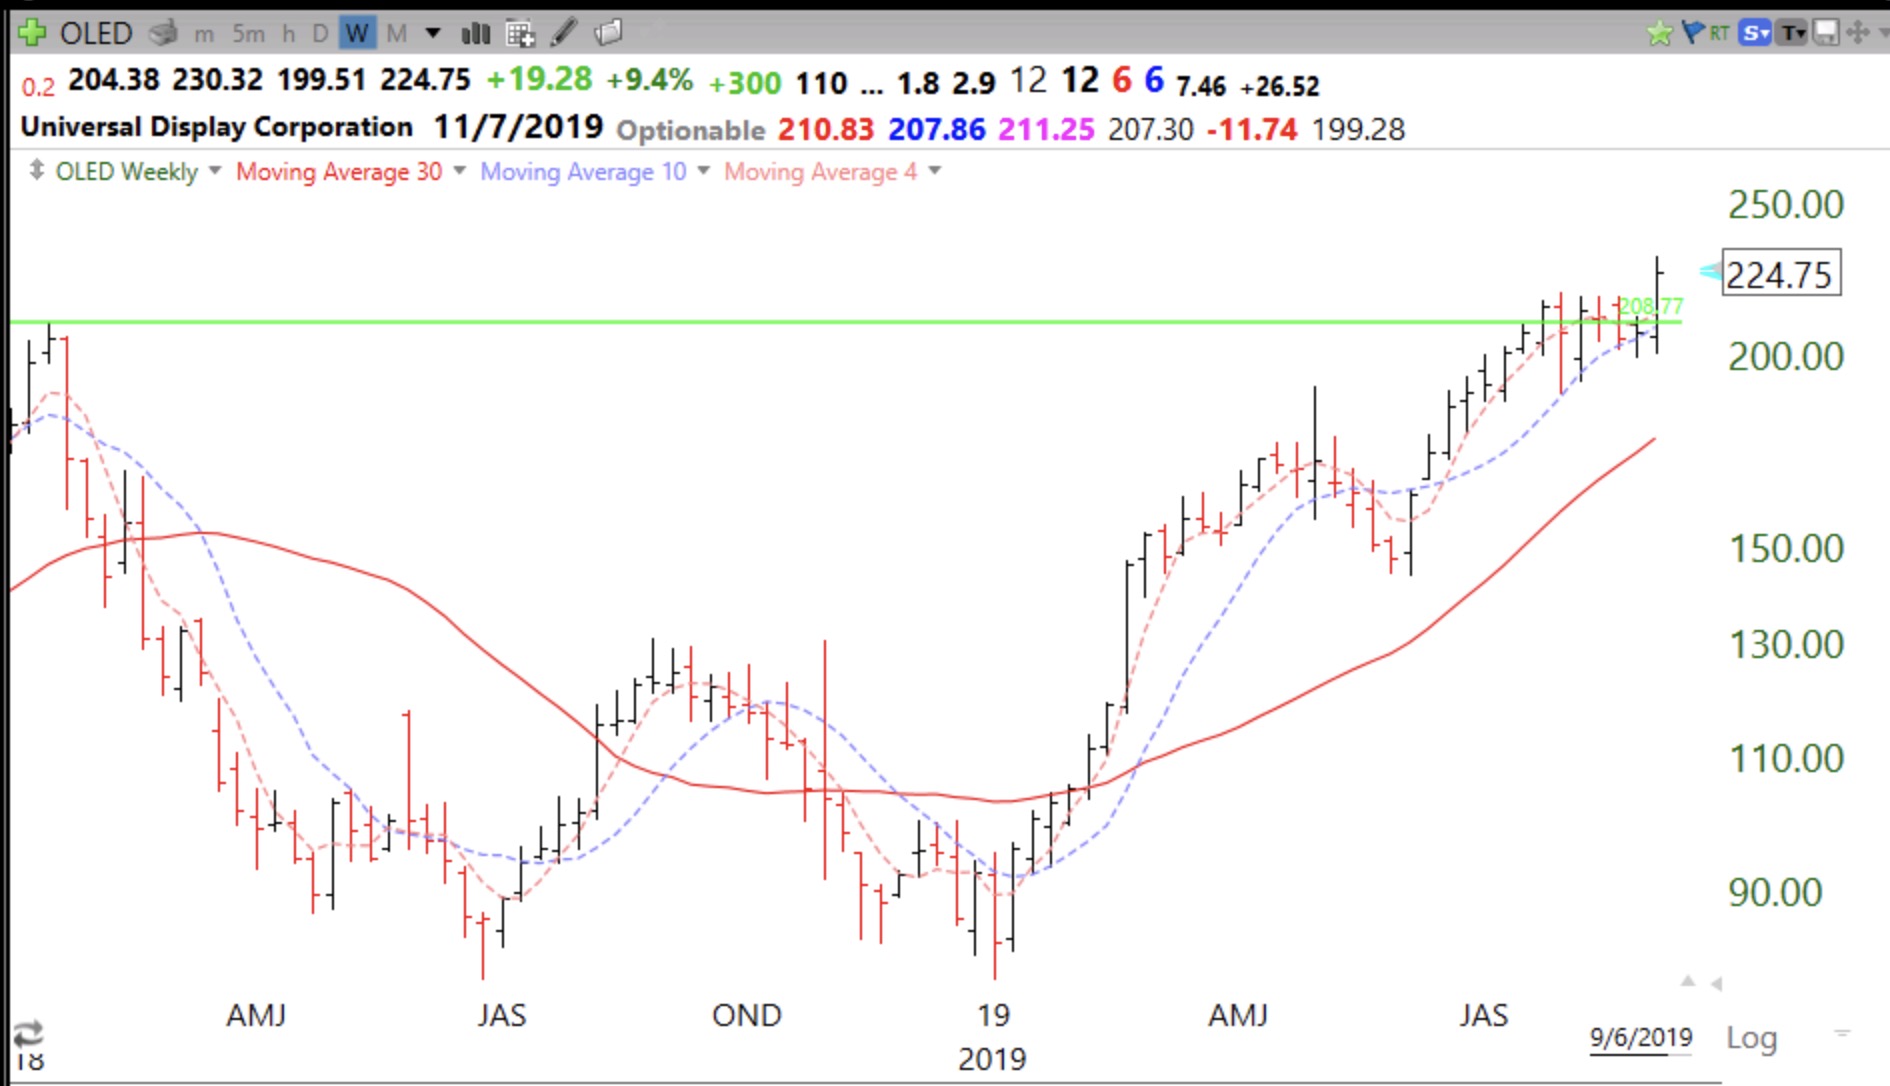
I also like a 10 week bounce to a new high on a stock that is above its last green line top. COUP is an example of this set up.
If I buy these set ups I sell if it closes back below its 10 week average or the weekly low of the bounce.
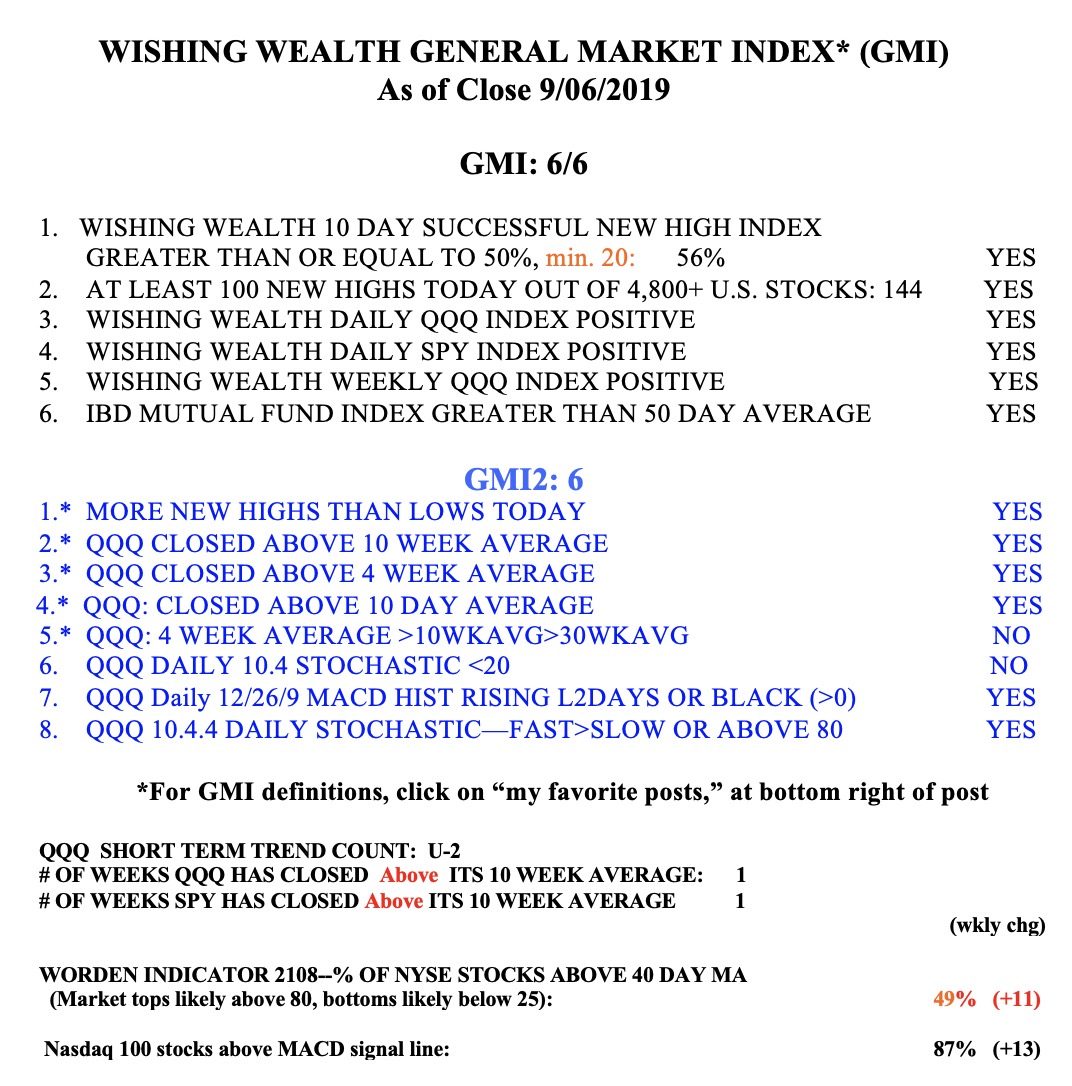
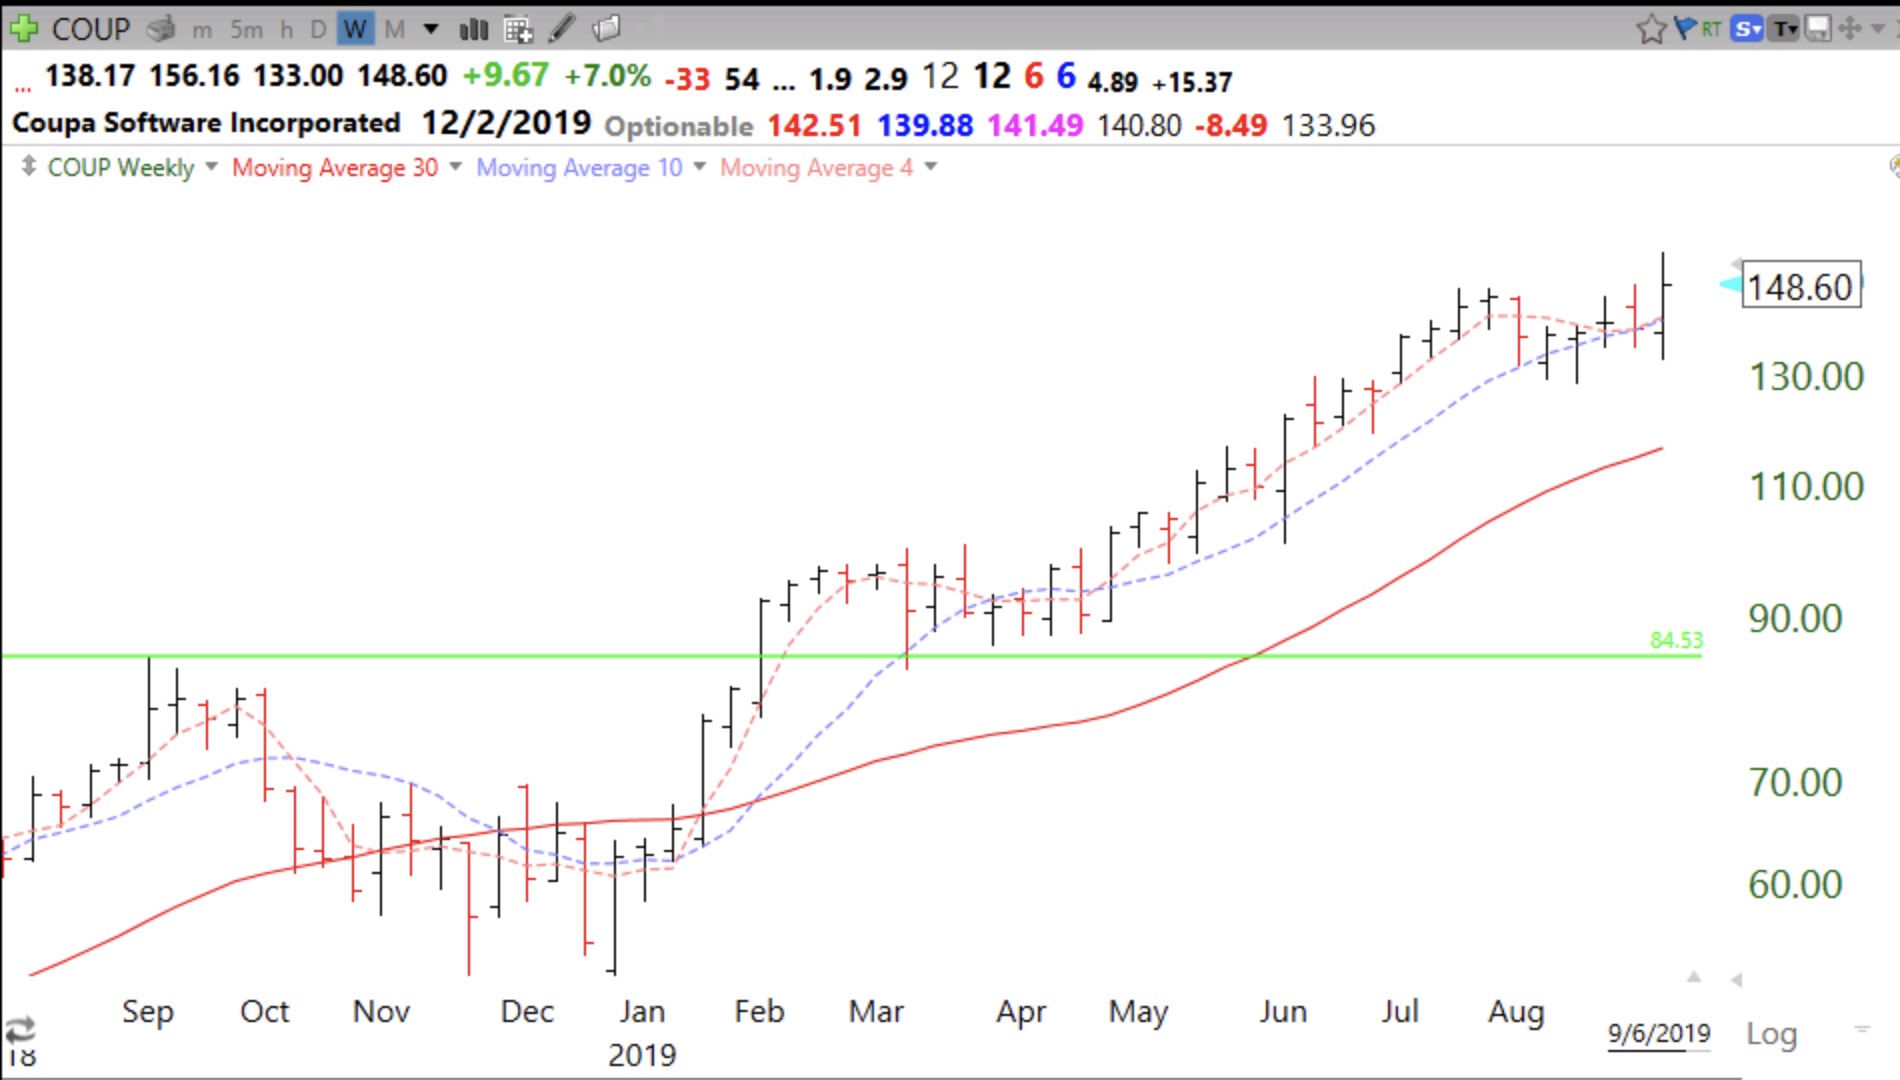
With the GMI strong, it is time to look for GLBs.