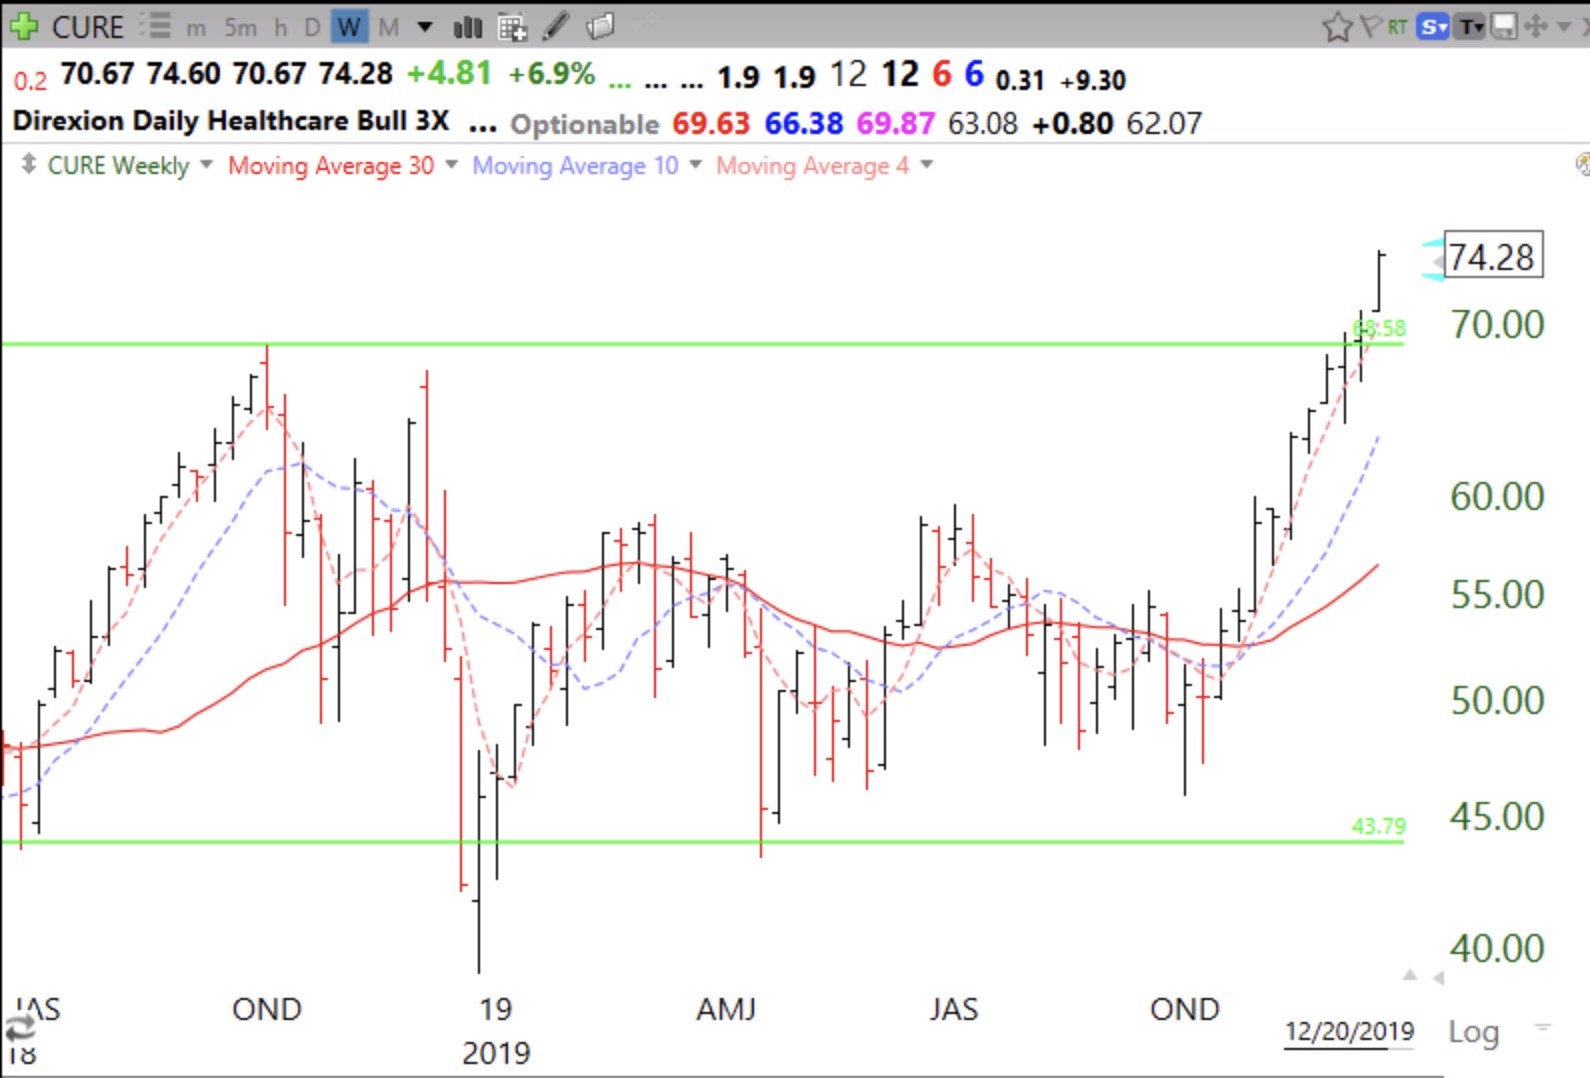
The 3x triple leveraged health care ETF, CURE, has broken out to all-time highs.
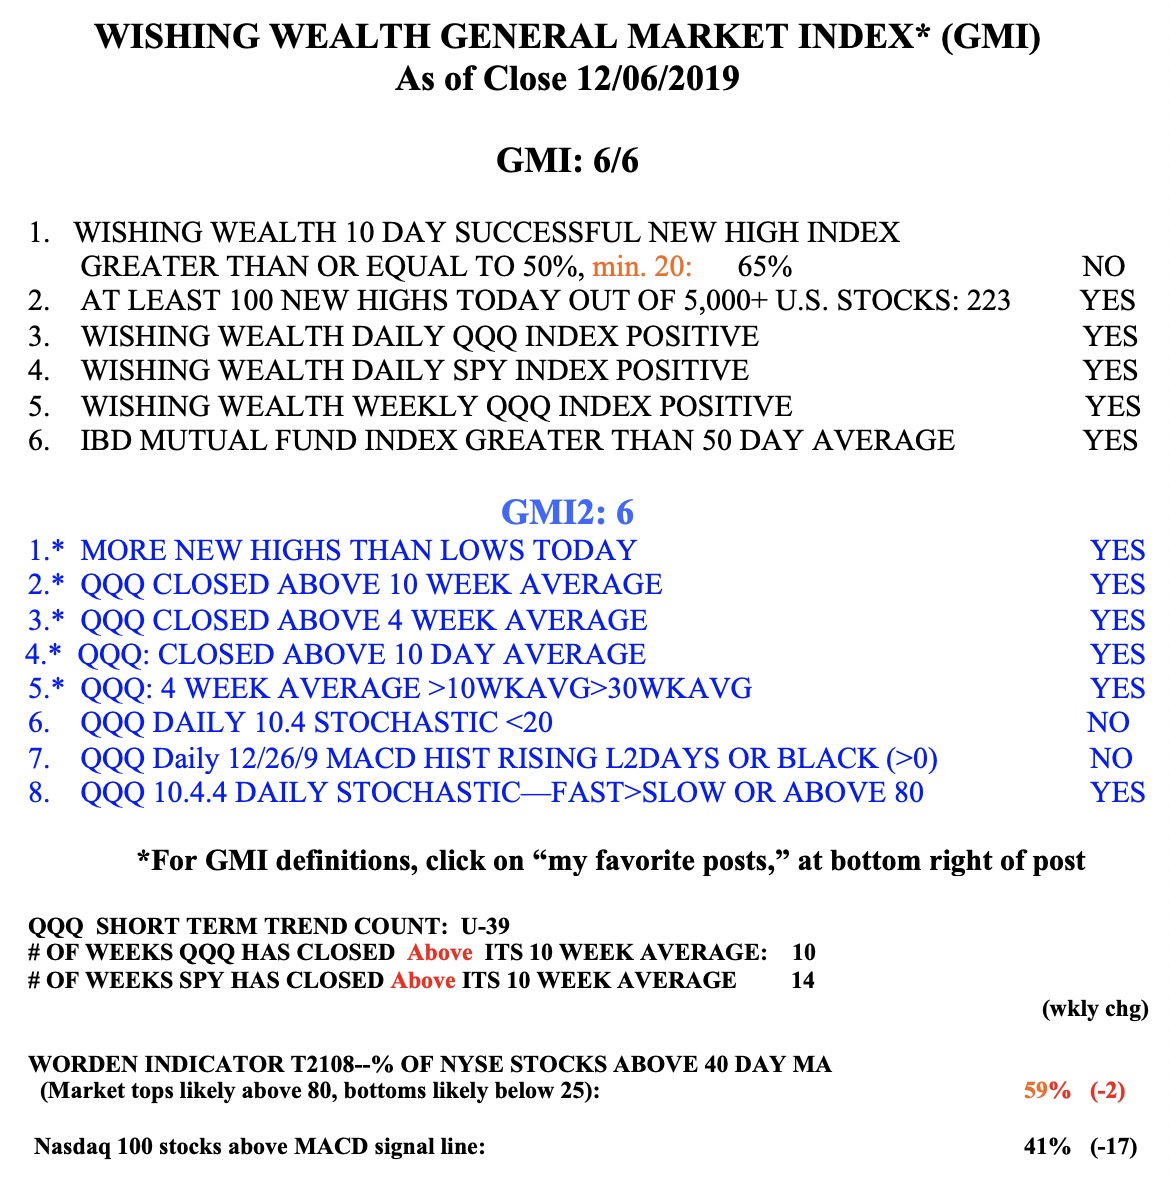
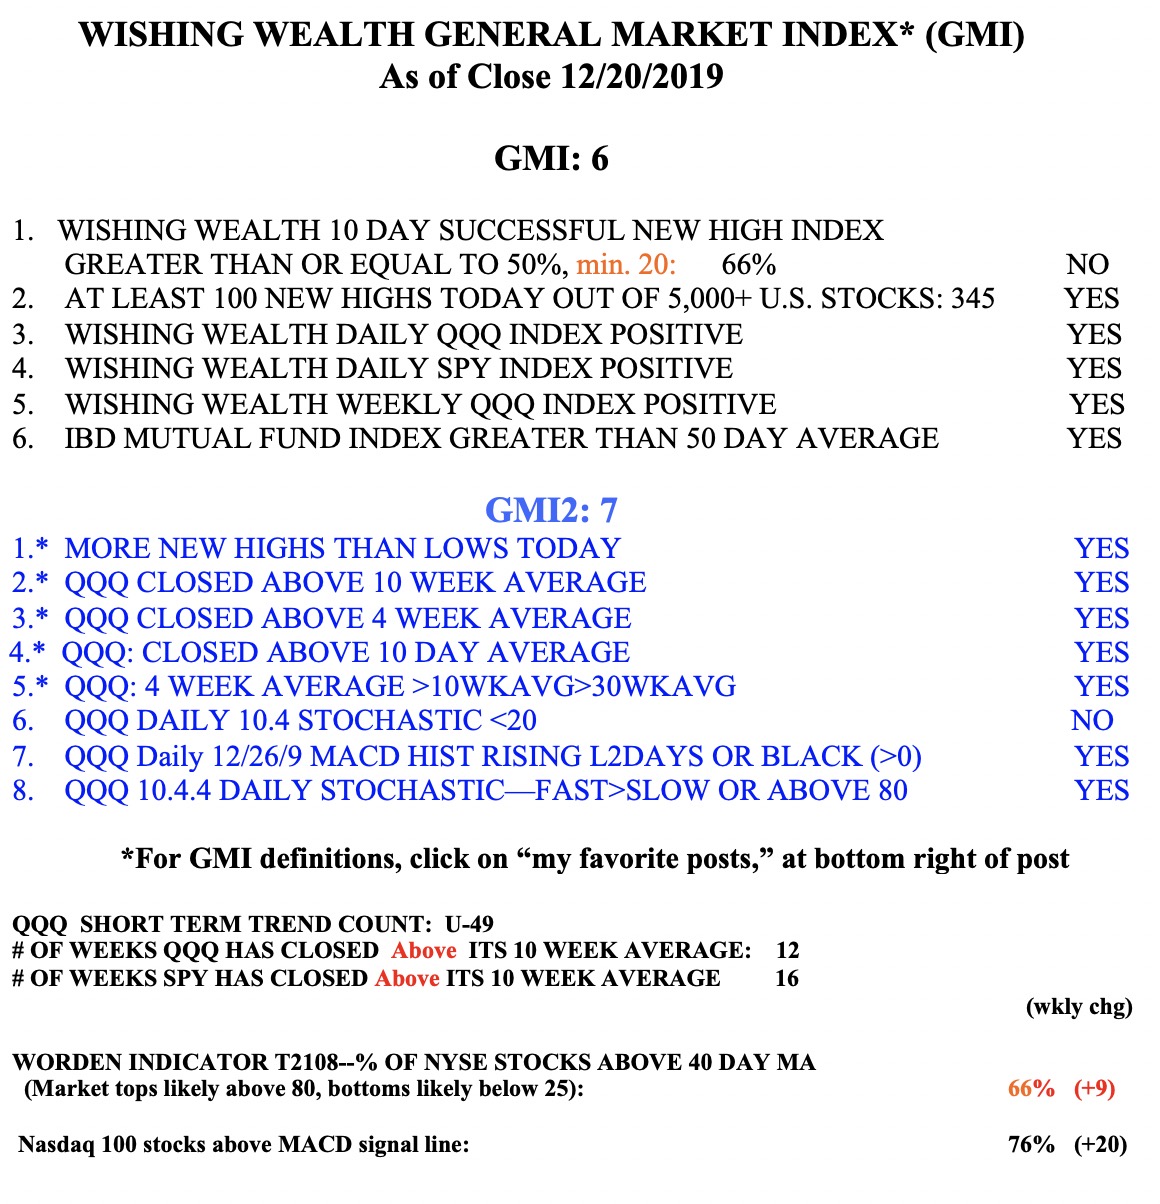
The GMI remains at 6 (of 6) and on a Green signal.
Stock Market Technical Indicators & Analysis
The 3x triple leveraged health care ETF, CURE, has broken out to all-time highs.
The GMI remains at 6 (of 6) and on a Green signal.
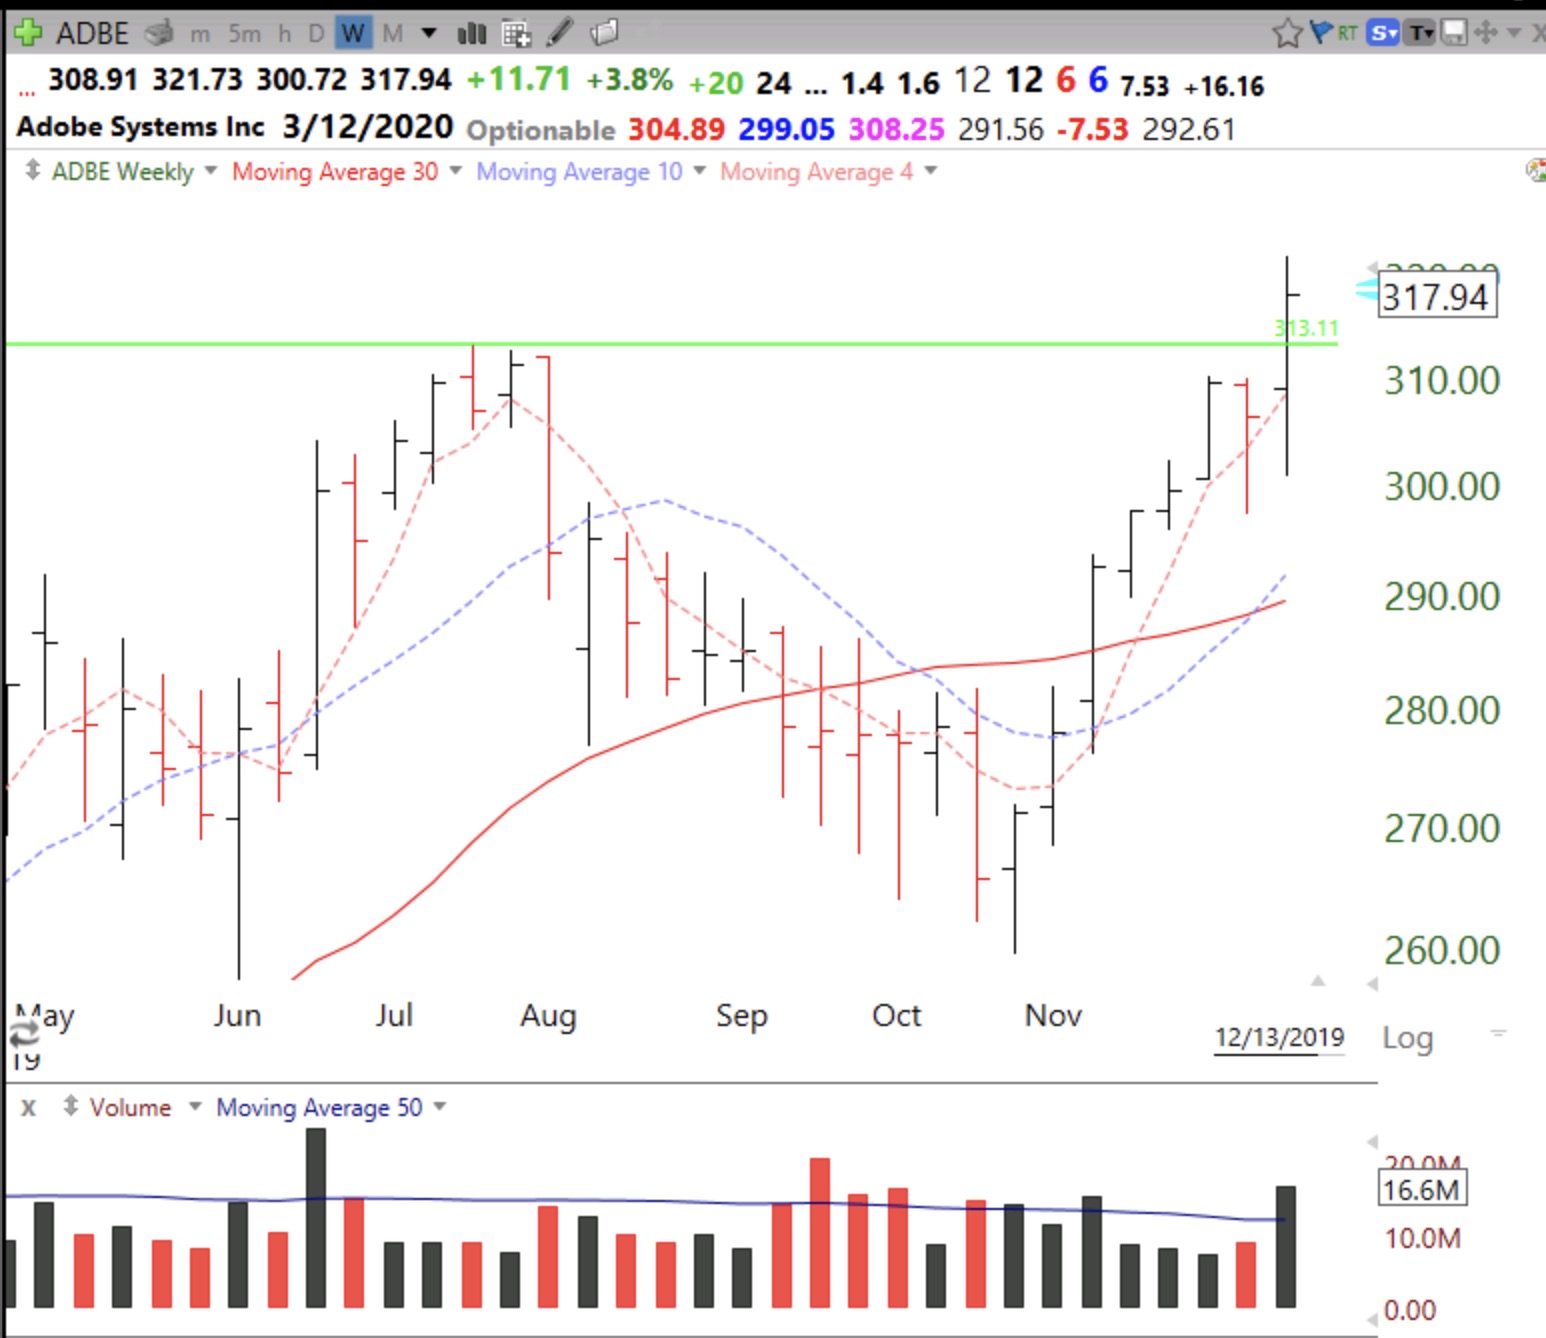
While not all GLBs (green line break-out) work out, they are worth monitoring for a low risk entry. If I bought ADBE now (weekly chart below), I would exit immediately if it closed back below its green line. My loss would be about 5 points. Always set a real or mental stop loss and calculate your risk before entering a position. Be sure to check out the table of the performance of selected recent GLBs by scrolling down on this page.
Nicolas Darvas liked to buy stocks that have already doubled. These eight stocks hit an all time high on Friday and are 2.1x or more their lowest price the past year. LULU reports earnings on 12/11. All are above their last green line tops. I will keep them in a watch list and wait for them to bounce from support to take a position. Below is a table I built in TC2000 showing next earnings date, close, and close/close a year ago.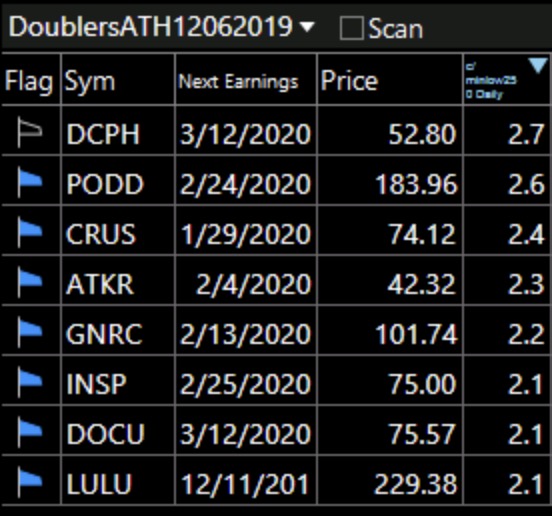
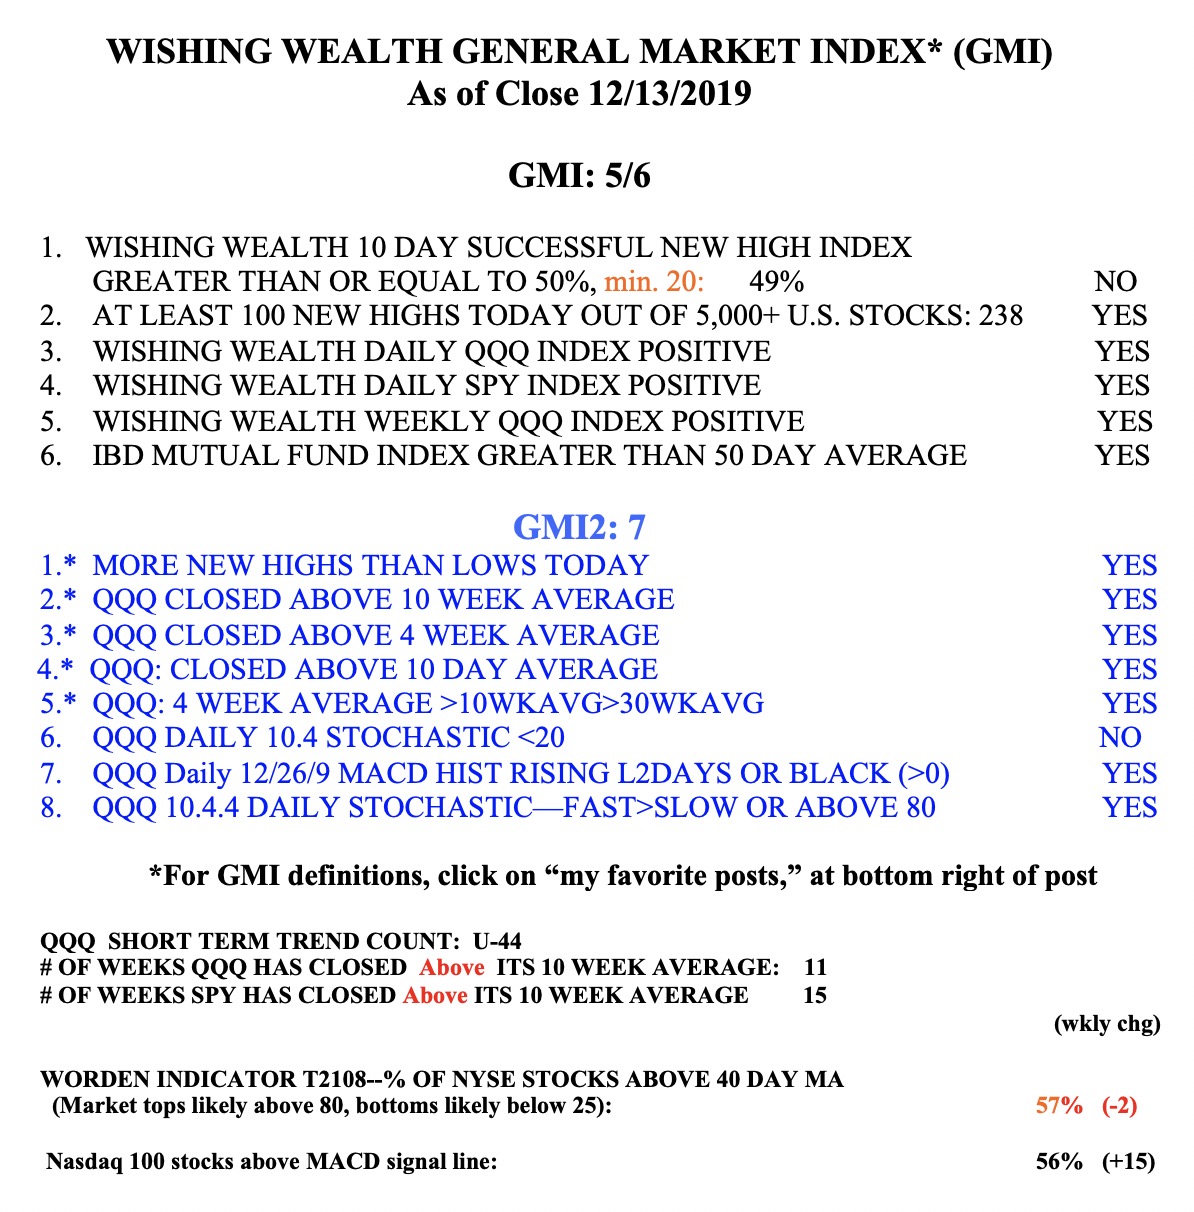
GMI is at 6 (of 6) and on a Green signal.