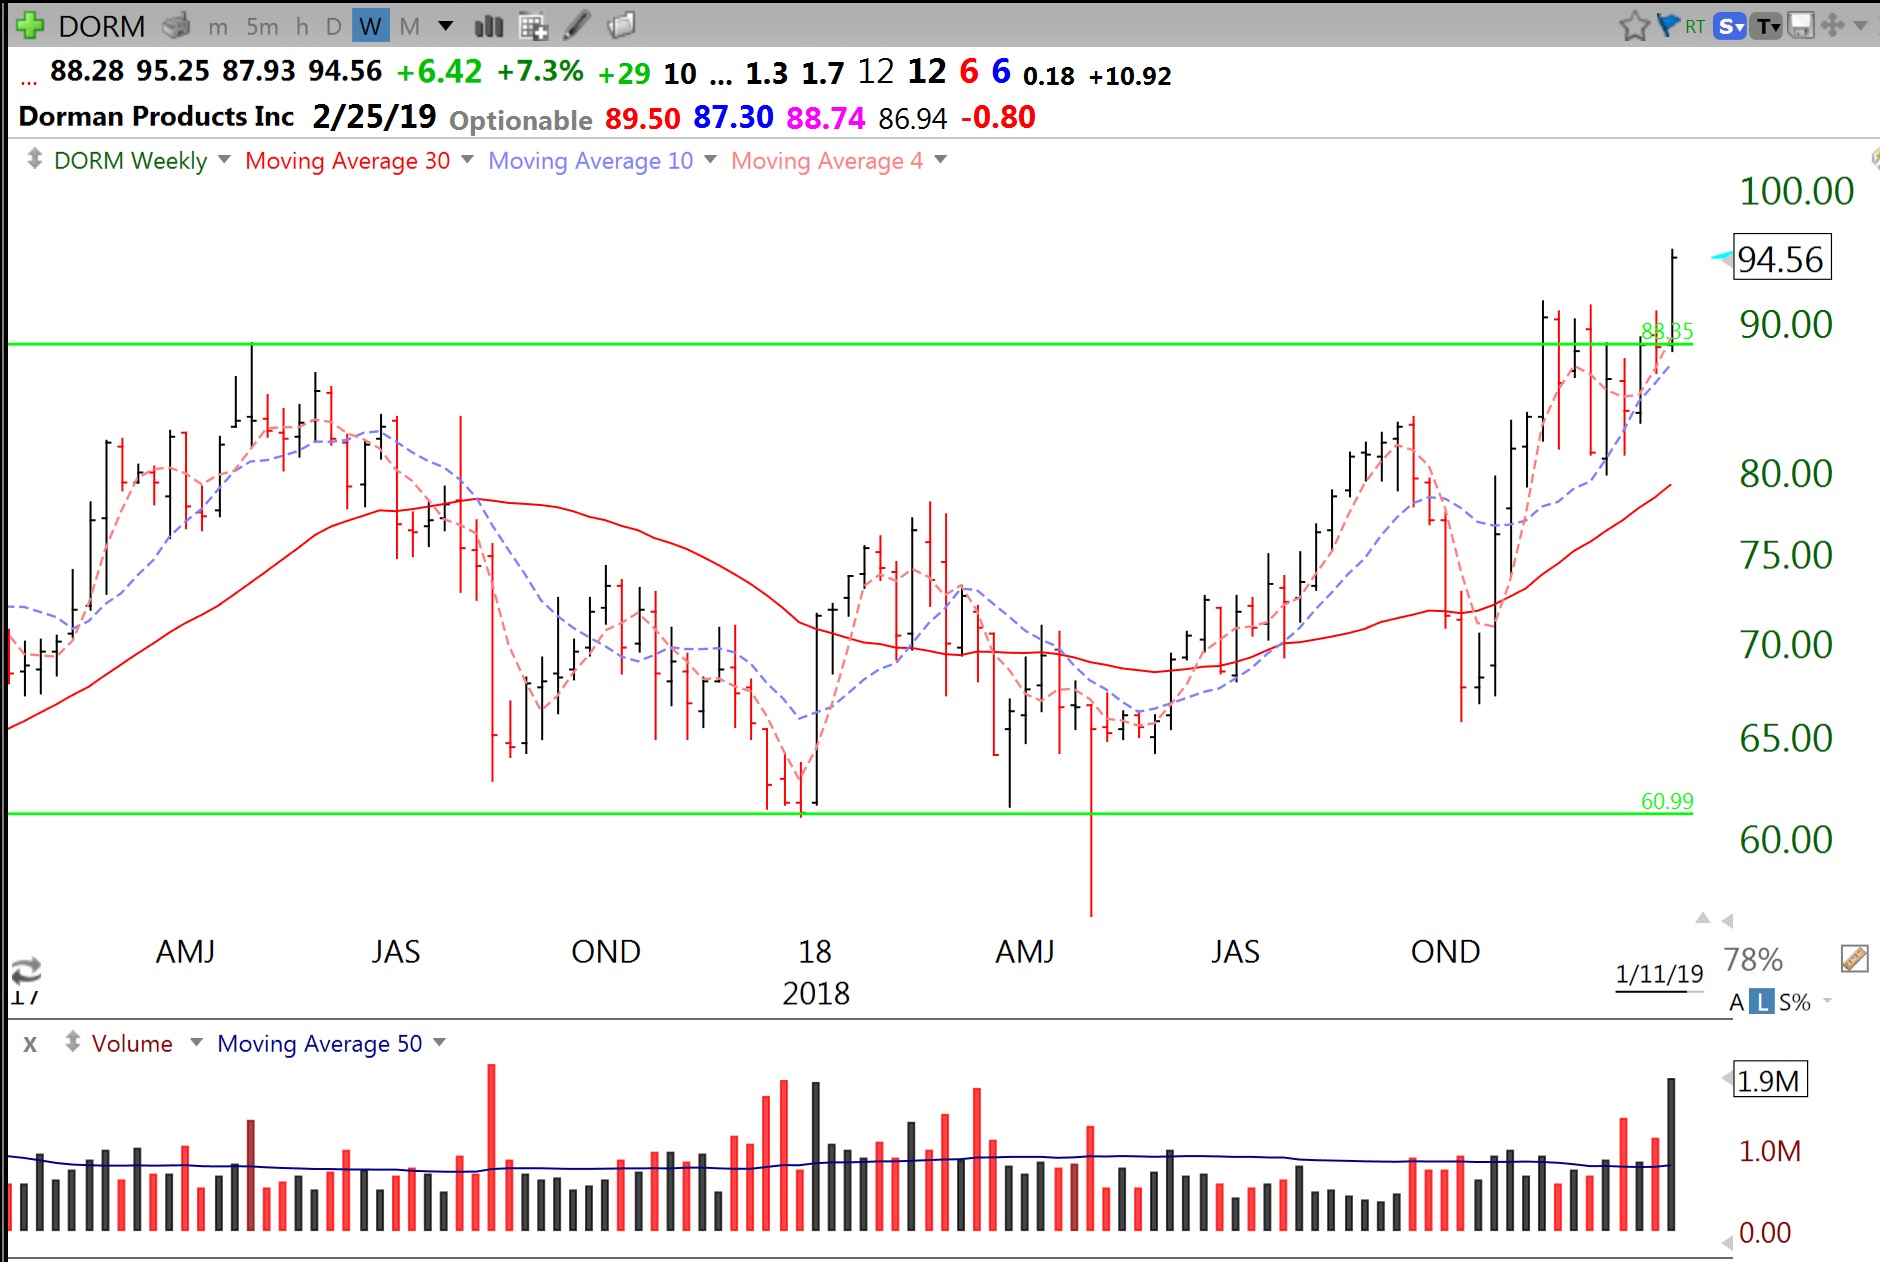
During this down-trend there are still a few growth stocks (about 10) hitting all-time highs (ATH). DORM is one, as shown by this weekly chart. Note last week’s above average volume at the Green Line Break-out (GLB, see blog glossary). I wrote about FN last week.
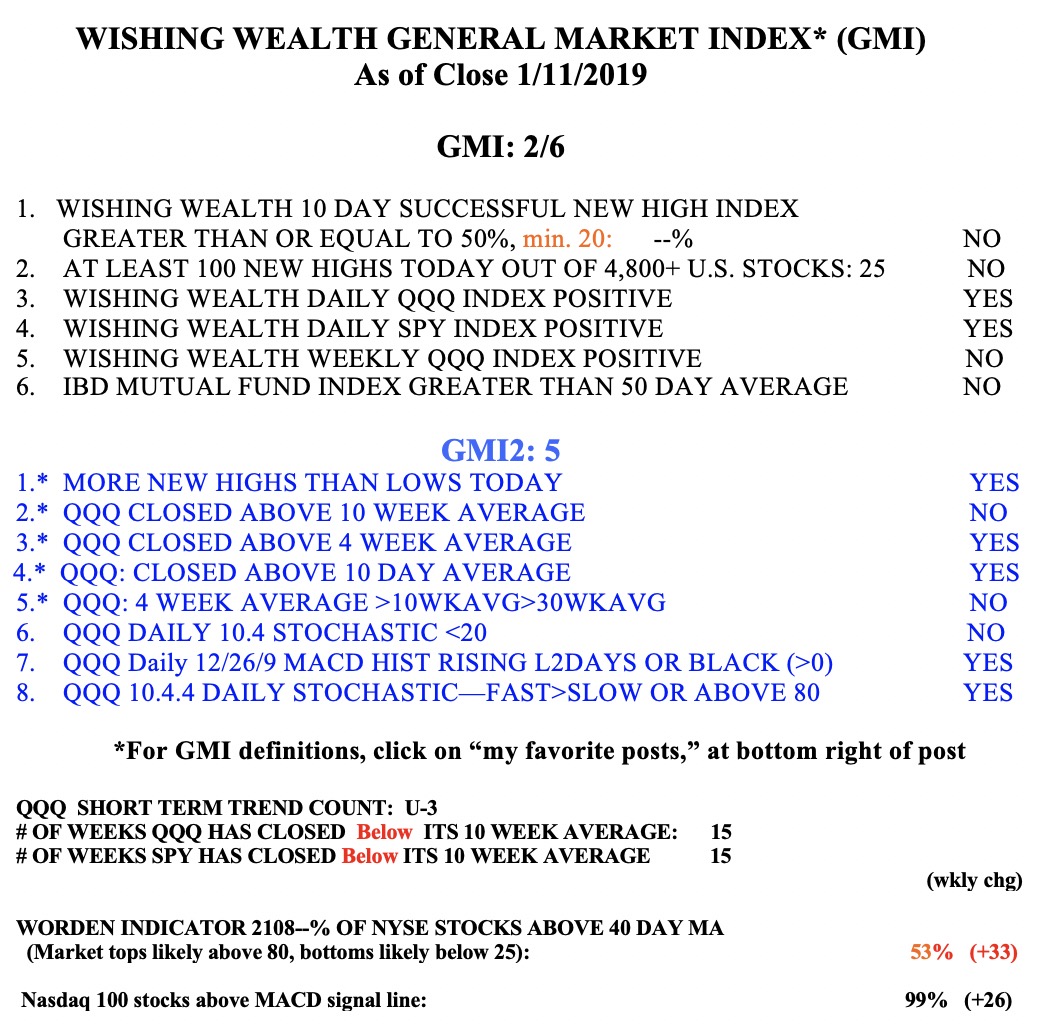
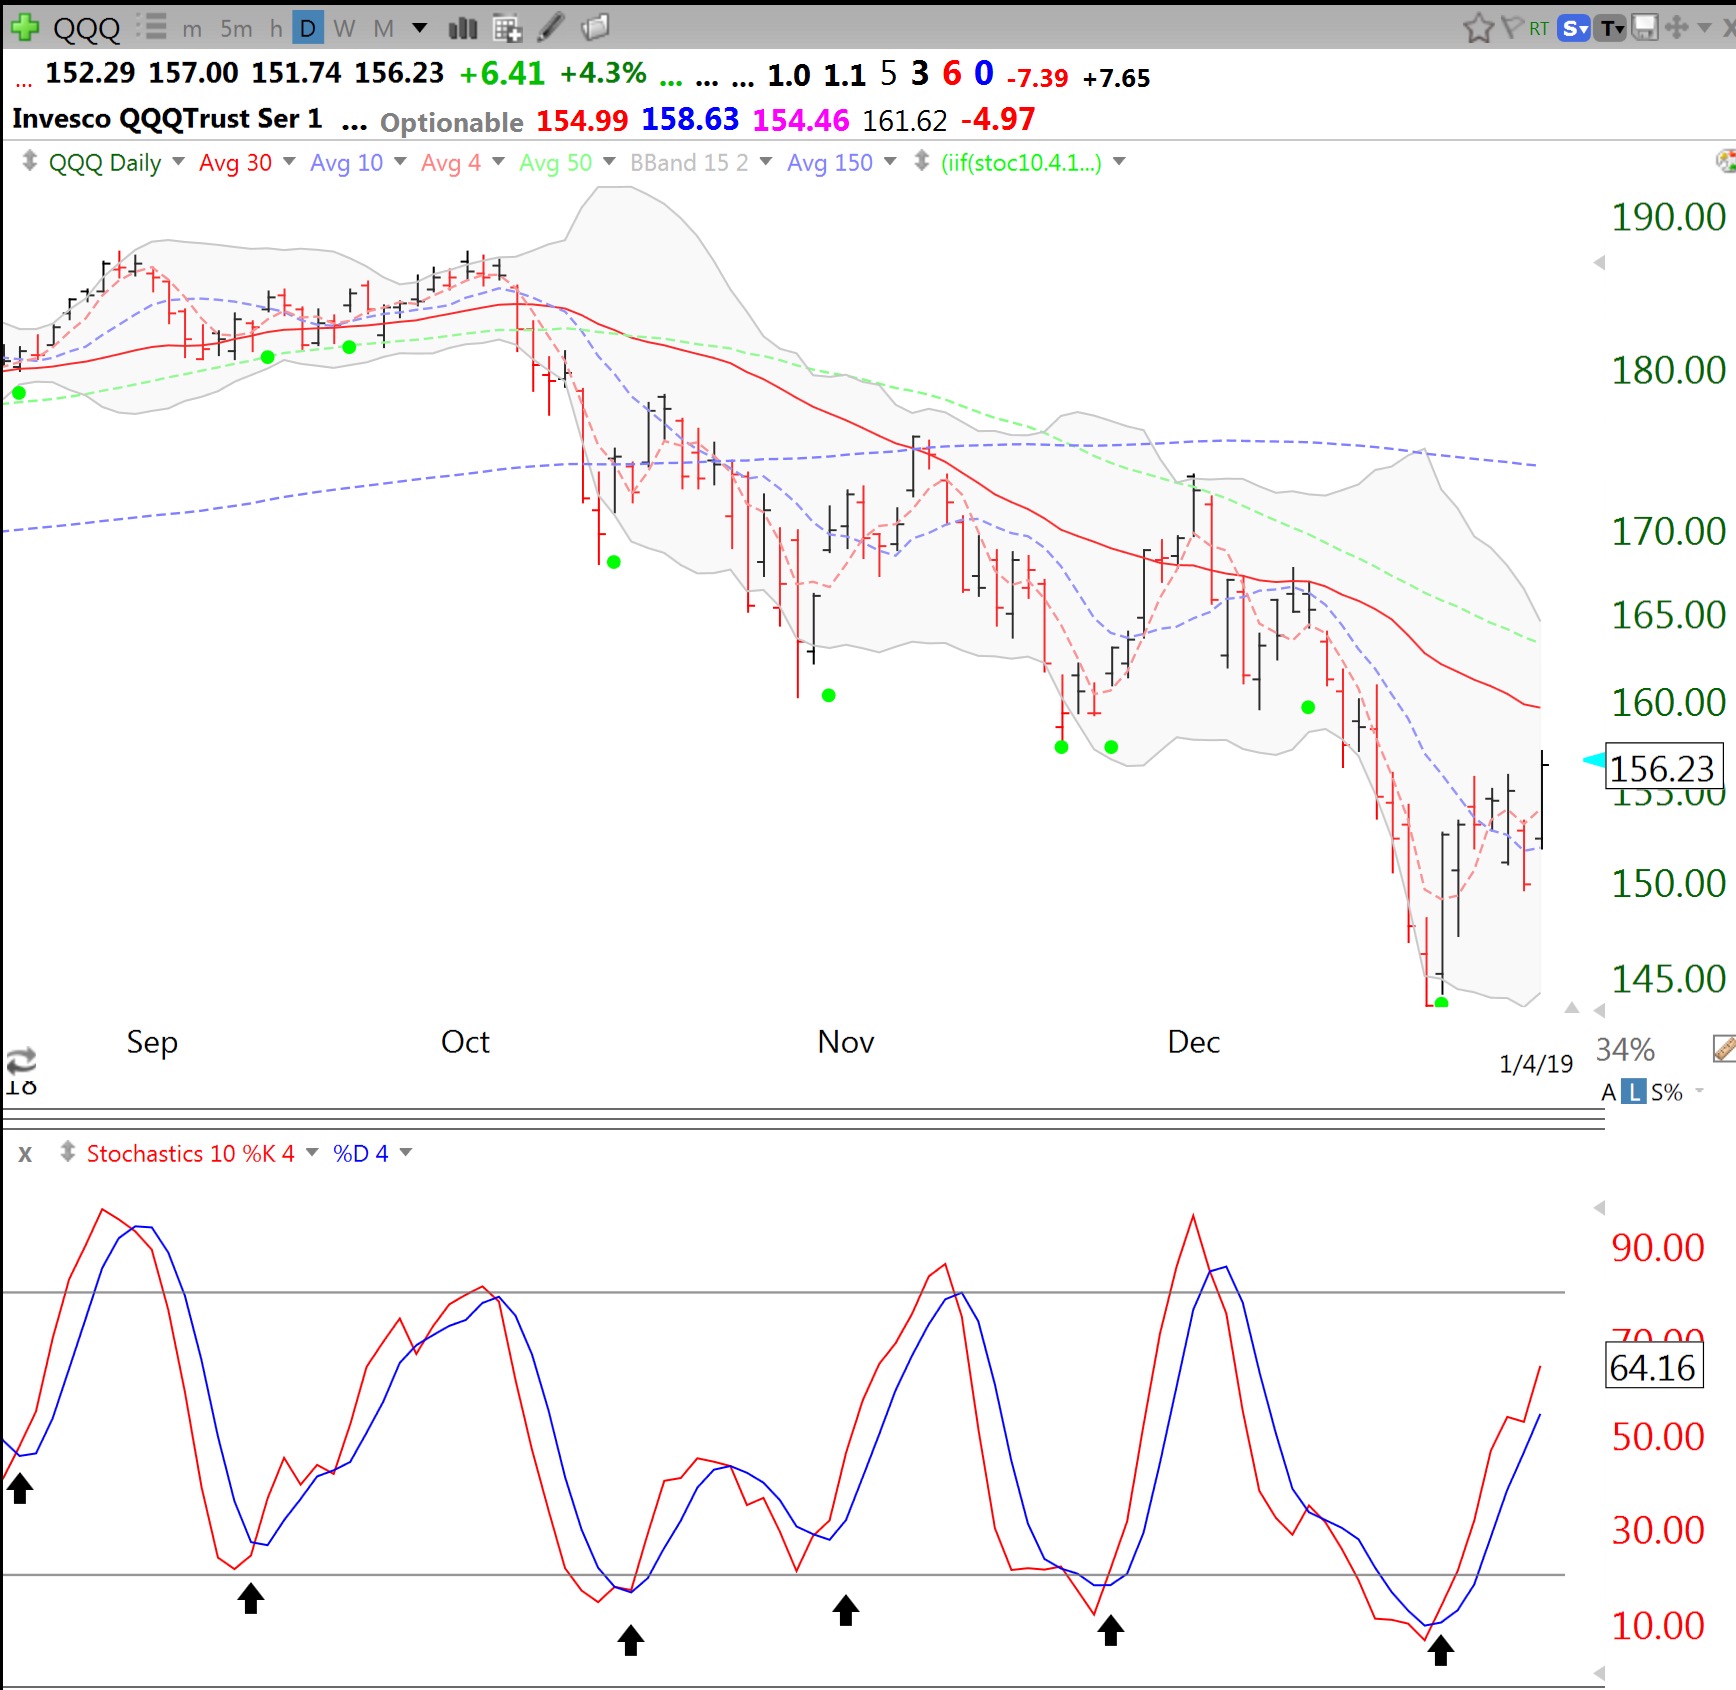
The indexes are right up against resistance after the snap back rally. Daily stochastics are very over bought. This week should tell whether we re-test the lows or break through.