I happened to see an article over the weekend presenting an analysis that showed that by missing the best market days over many years one would have severely underperformed a portfolio that just stayed invested in the S&P500. Therefore, the author urged, just remain invested. However, these studies conveniently ignore the fact that many similar studies have also found that by missing the worst days in the period one would have vastly outperformed a buy and hold S&P500 portfolio. Here is one example from a story published by investors.com in 2006.
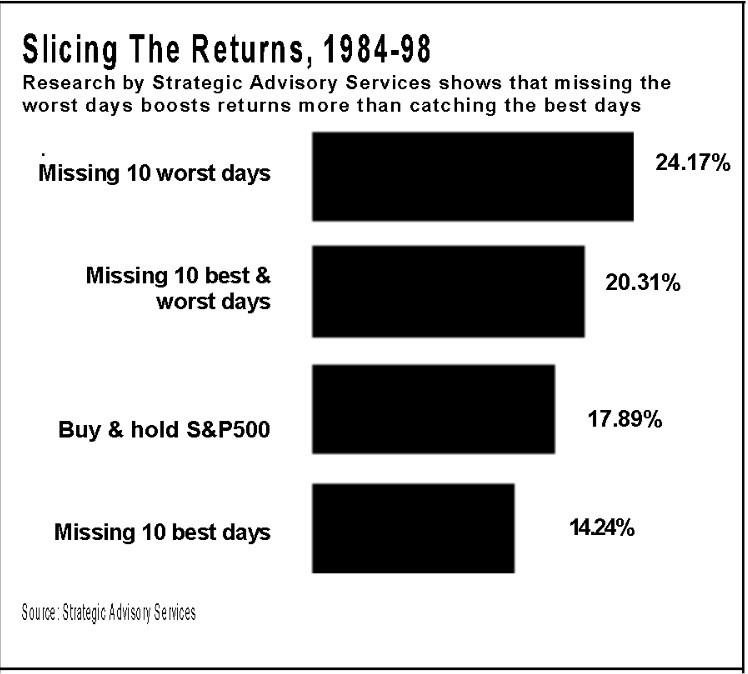
Thus if one could time the market and exit during turbulent times one does best. So, that analysis implies, exit the market during major declines. The fallacy from all of these analyses is that they assume the investor missed all of the best or worst days over many years. How could someone do that consistently over a multiyear period? None of these analyses makes any sense to me. If a financial advisor used such a study to keep me in the market I would run…
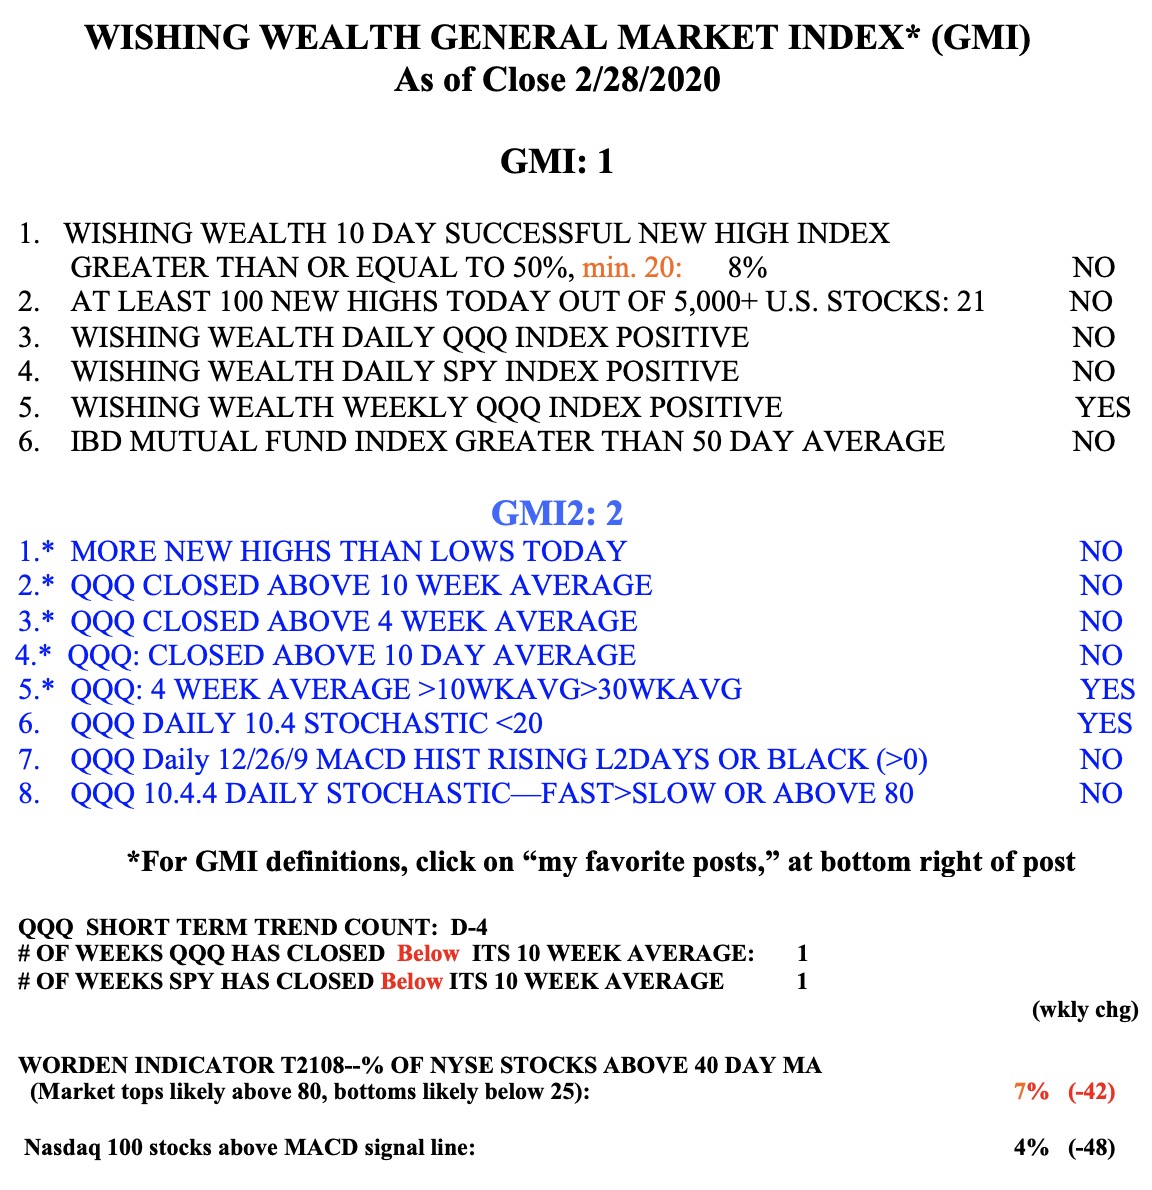
If this were a normal market environment, the indicators I follow are so oversold that I would have to begin to re-enter an index ETF in stages. The put/call ratio of 1.26 and the T2108 at 7% would indicate an imminent bounce. But the event risk from the likely pandemic suggests that bad news could pull the rug out from under the market at anytime. So I am safely on the sidelines in all of my accounts. All of my great trading gurus said there were times to be out of the market. I really do not care if I miss a 5-10% move up. I am trying to avoid a 20-50% decline instead. Anyone who feels compelled to remain long in this market should join gamblers anonymous.
The GMI remains Red, at 1 (of 6).
