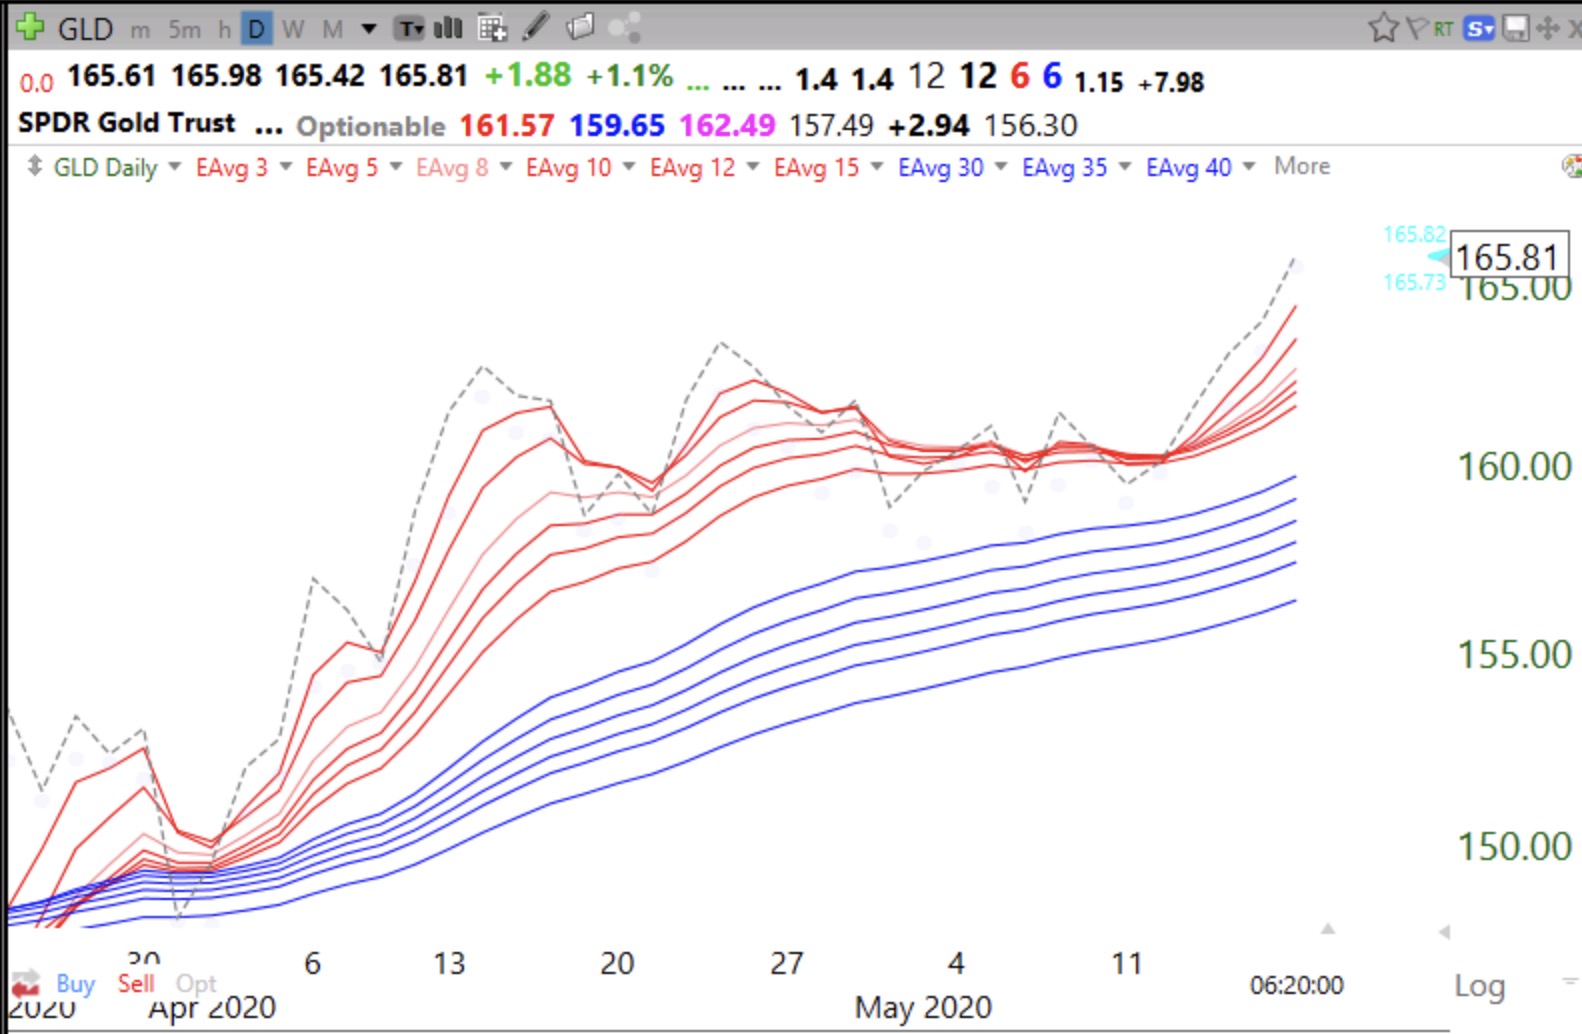
All we need is for the 10 week average (blue dotted line) to retake the 30 week average (solid red line).
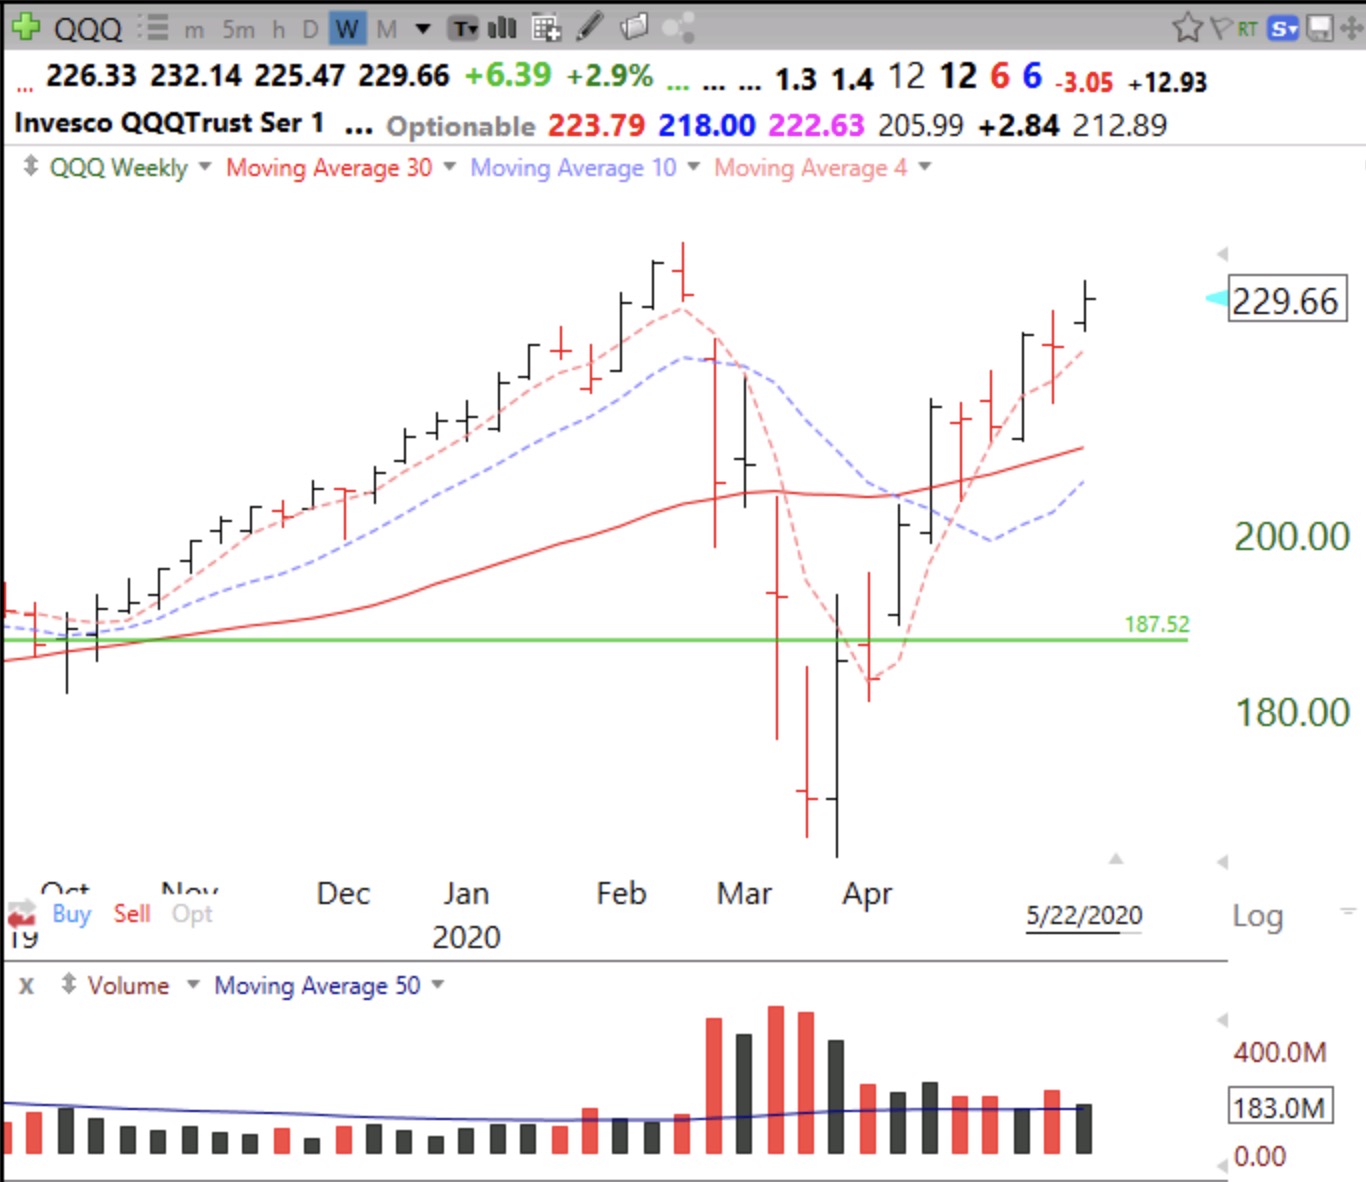
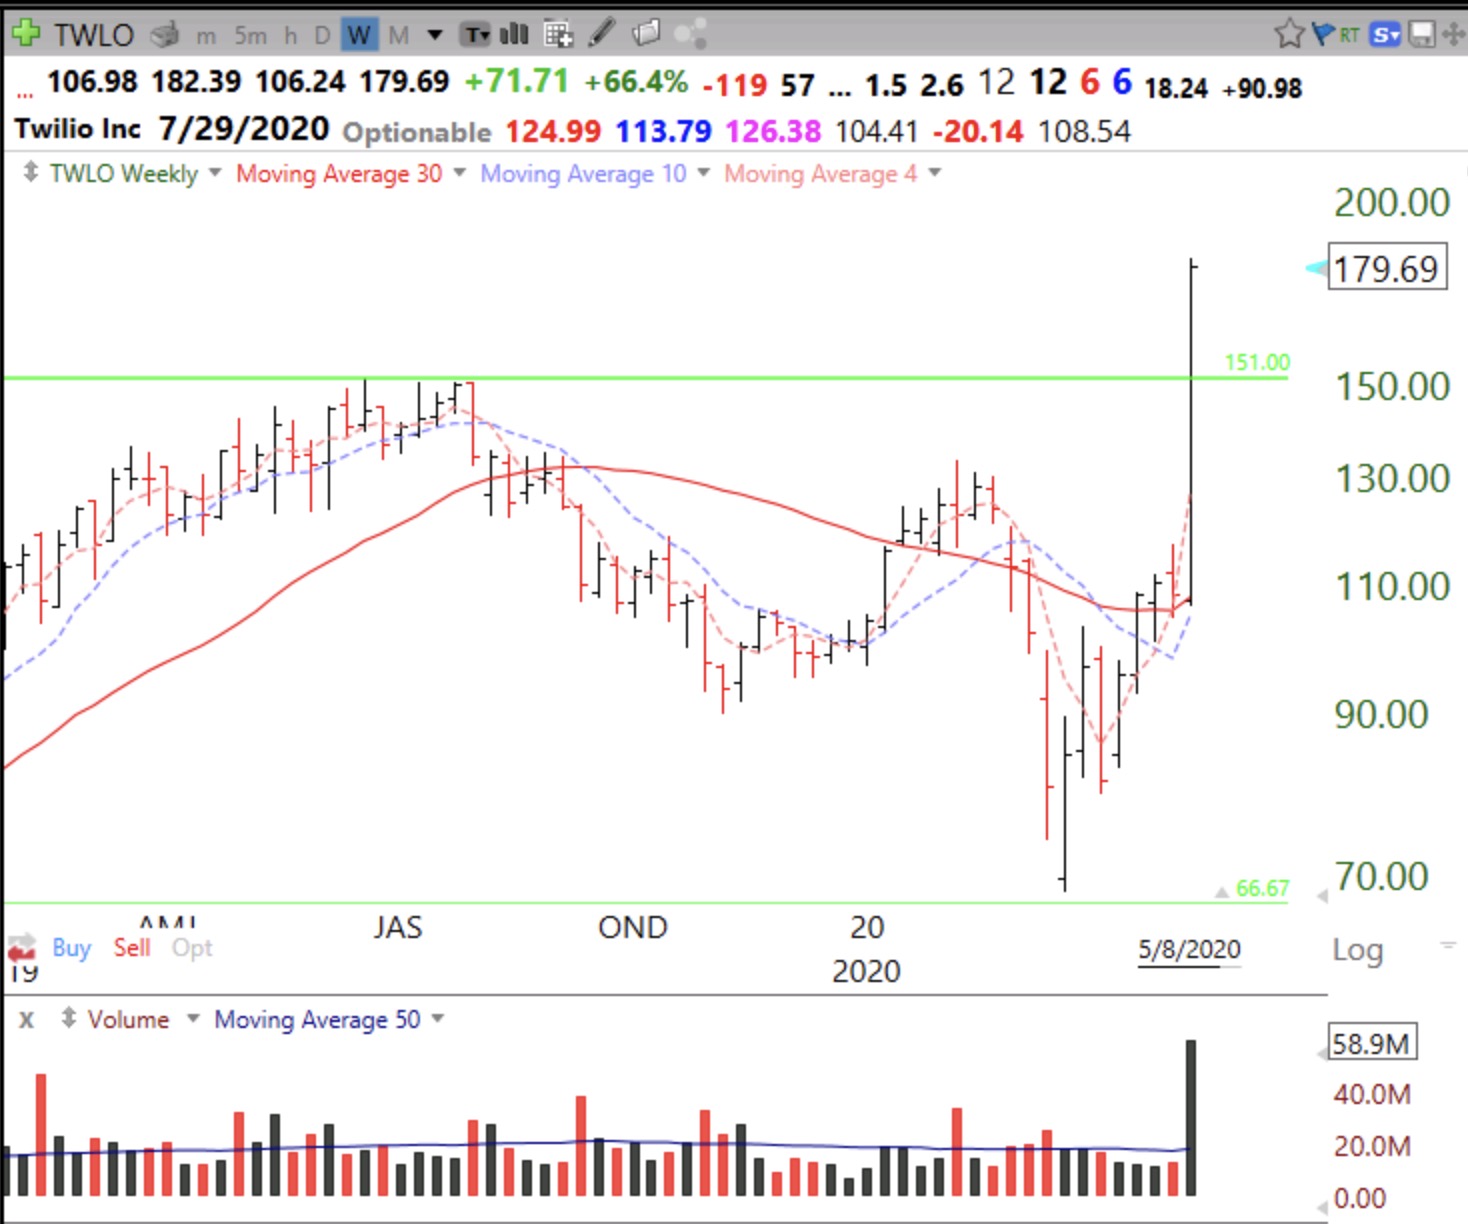
Many media pundits fear that the technically weaker DIA and SPY will meet resistance at their 30 week averages and head back down to retest the March lows. While anything is possible, the first major warning sign for me would be a weekly close in any of these indexes below their 4 week averages, and then a penetration of their 10 week averages. For now, I am holding TQQQ! Since the first day of my QQQ short term up-trend count, now at U-33, TQQQ is up +54%.
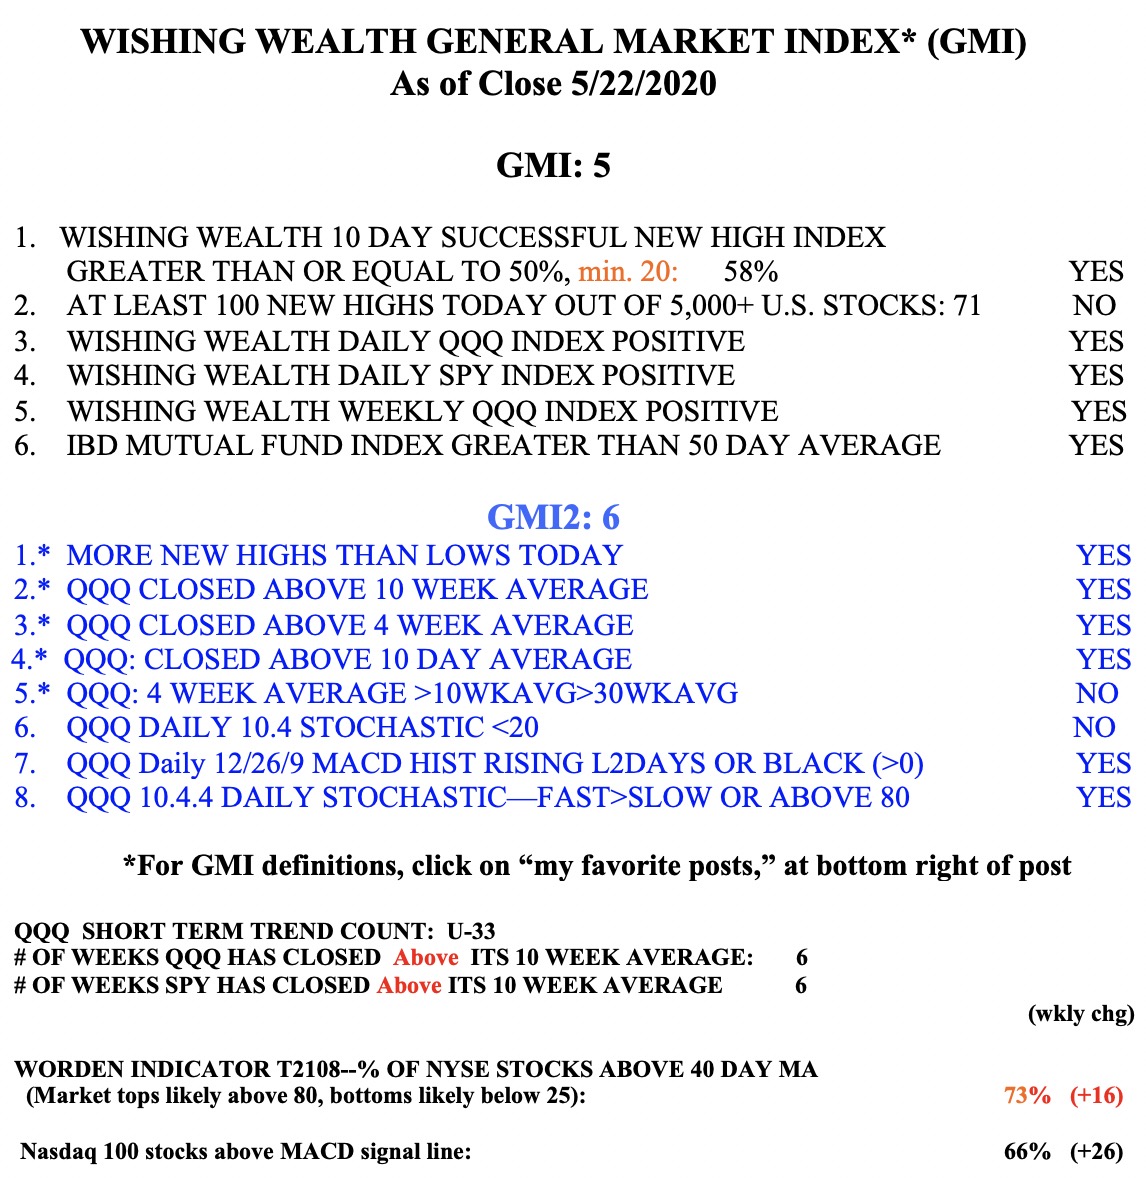
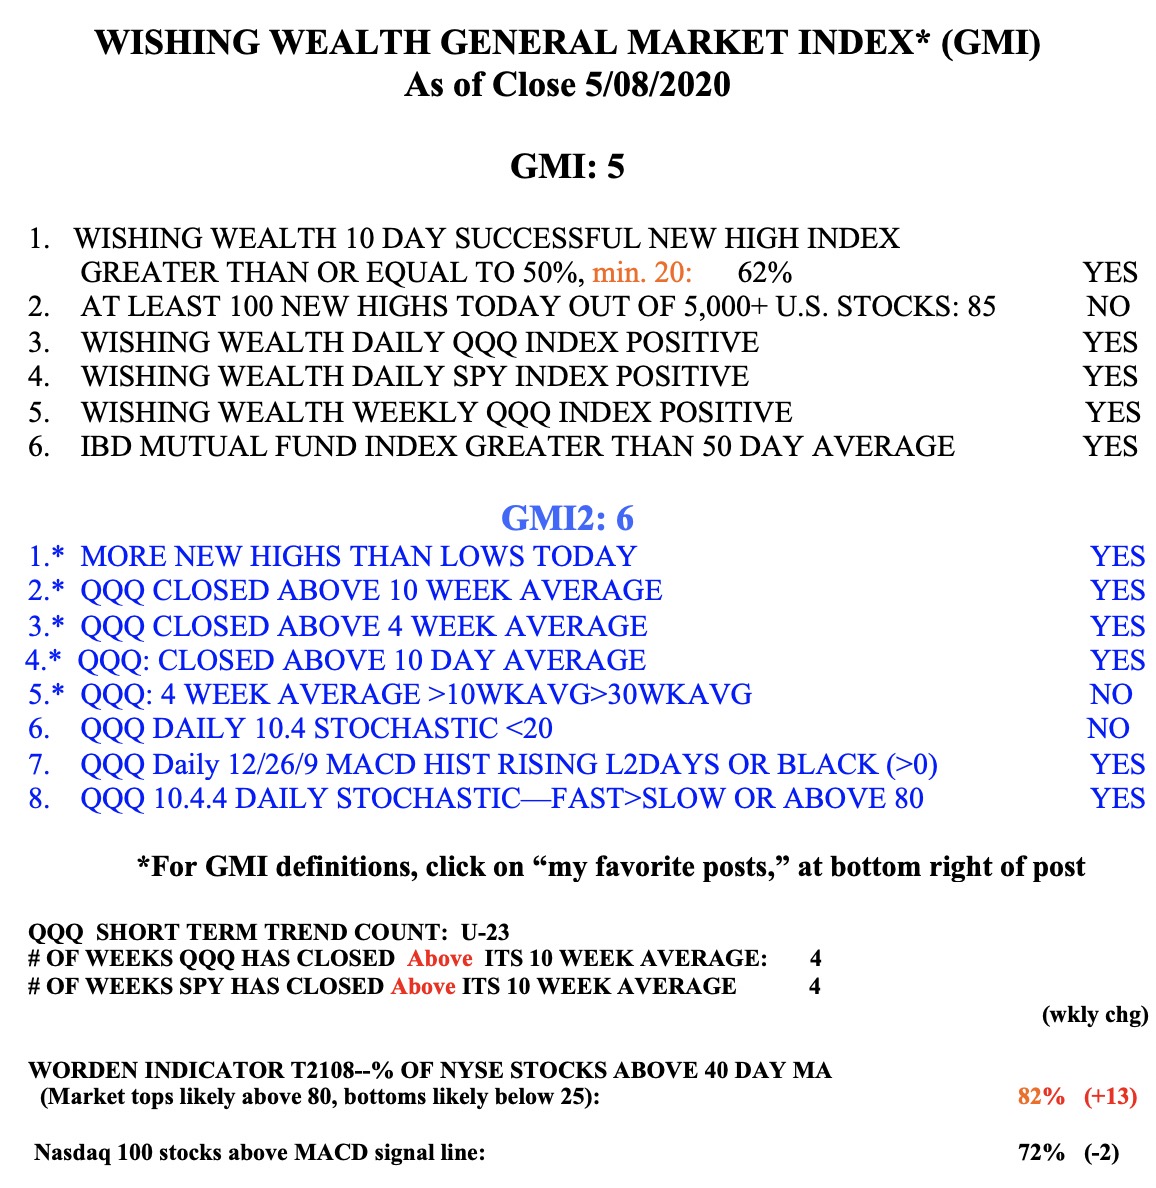
The GMI remains Green and at 5 (of 6).