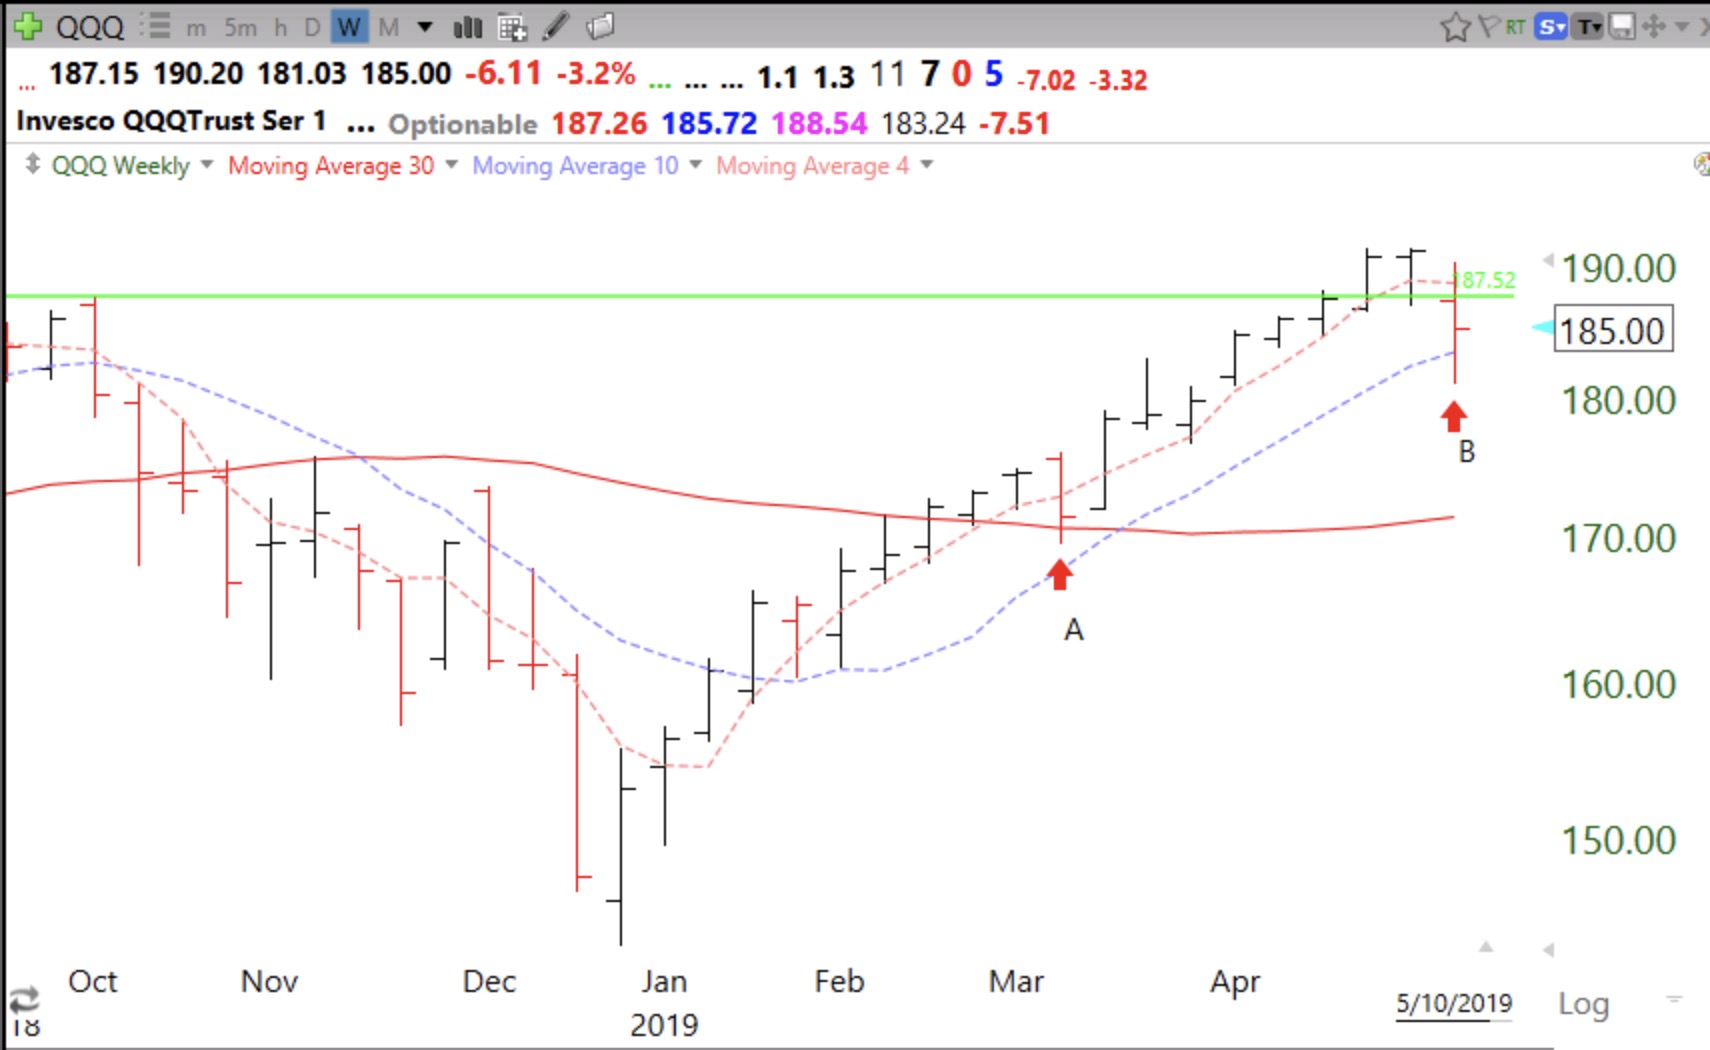
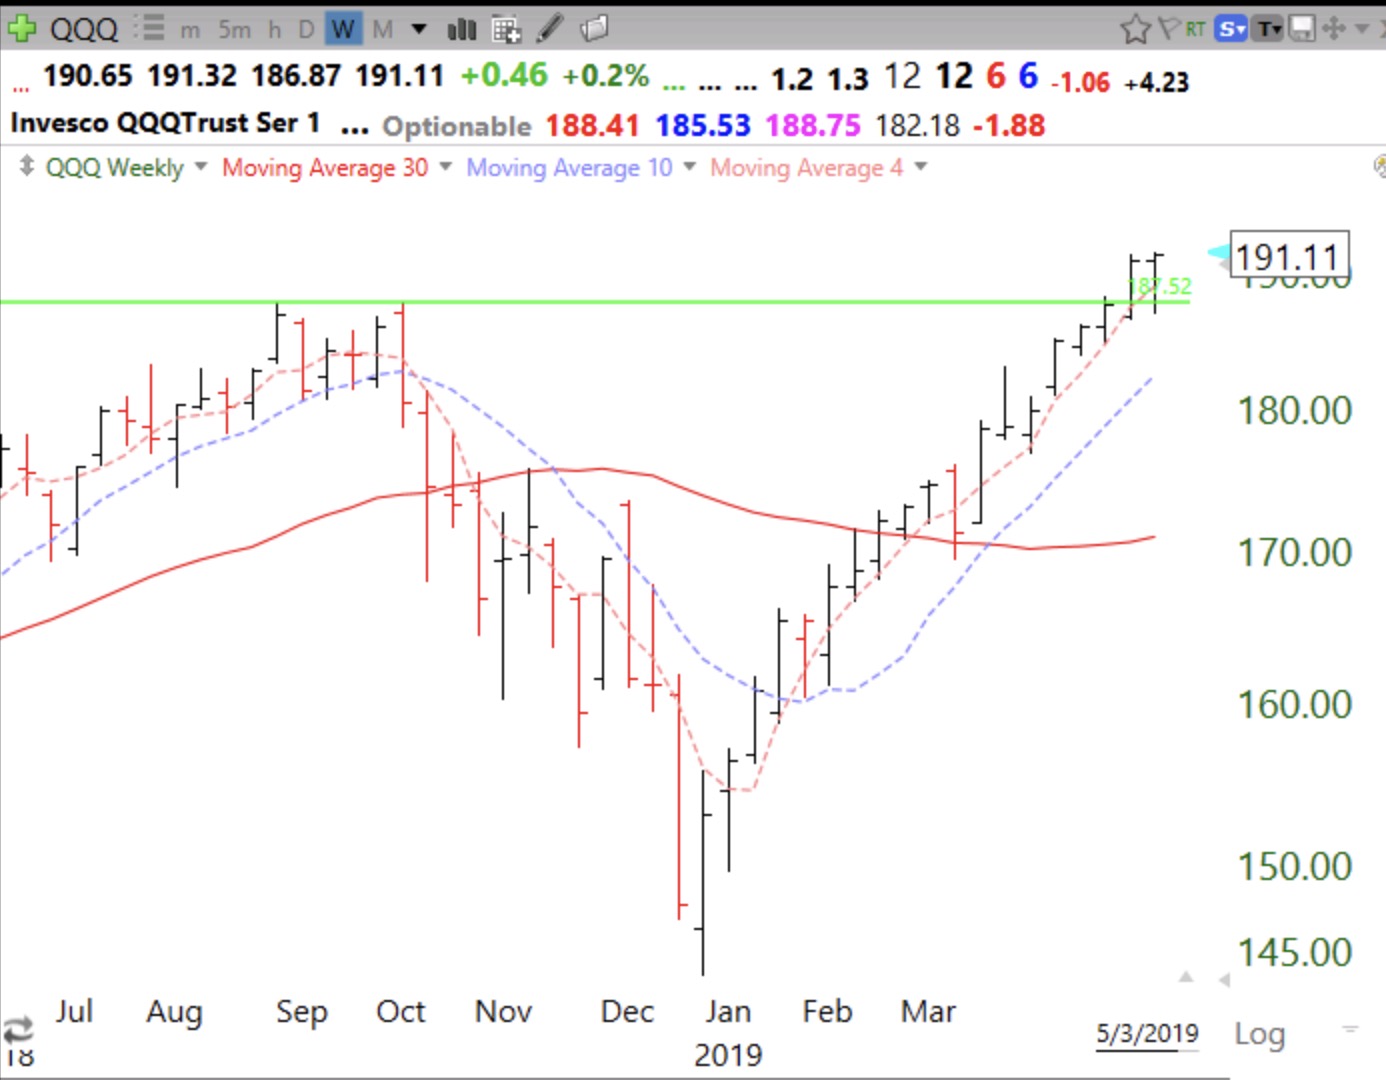
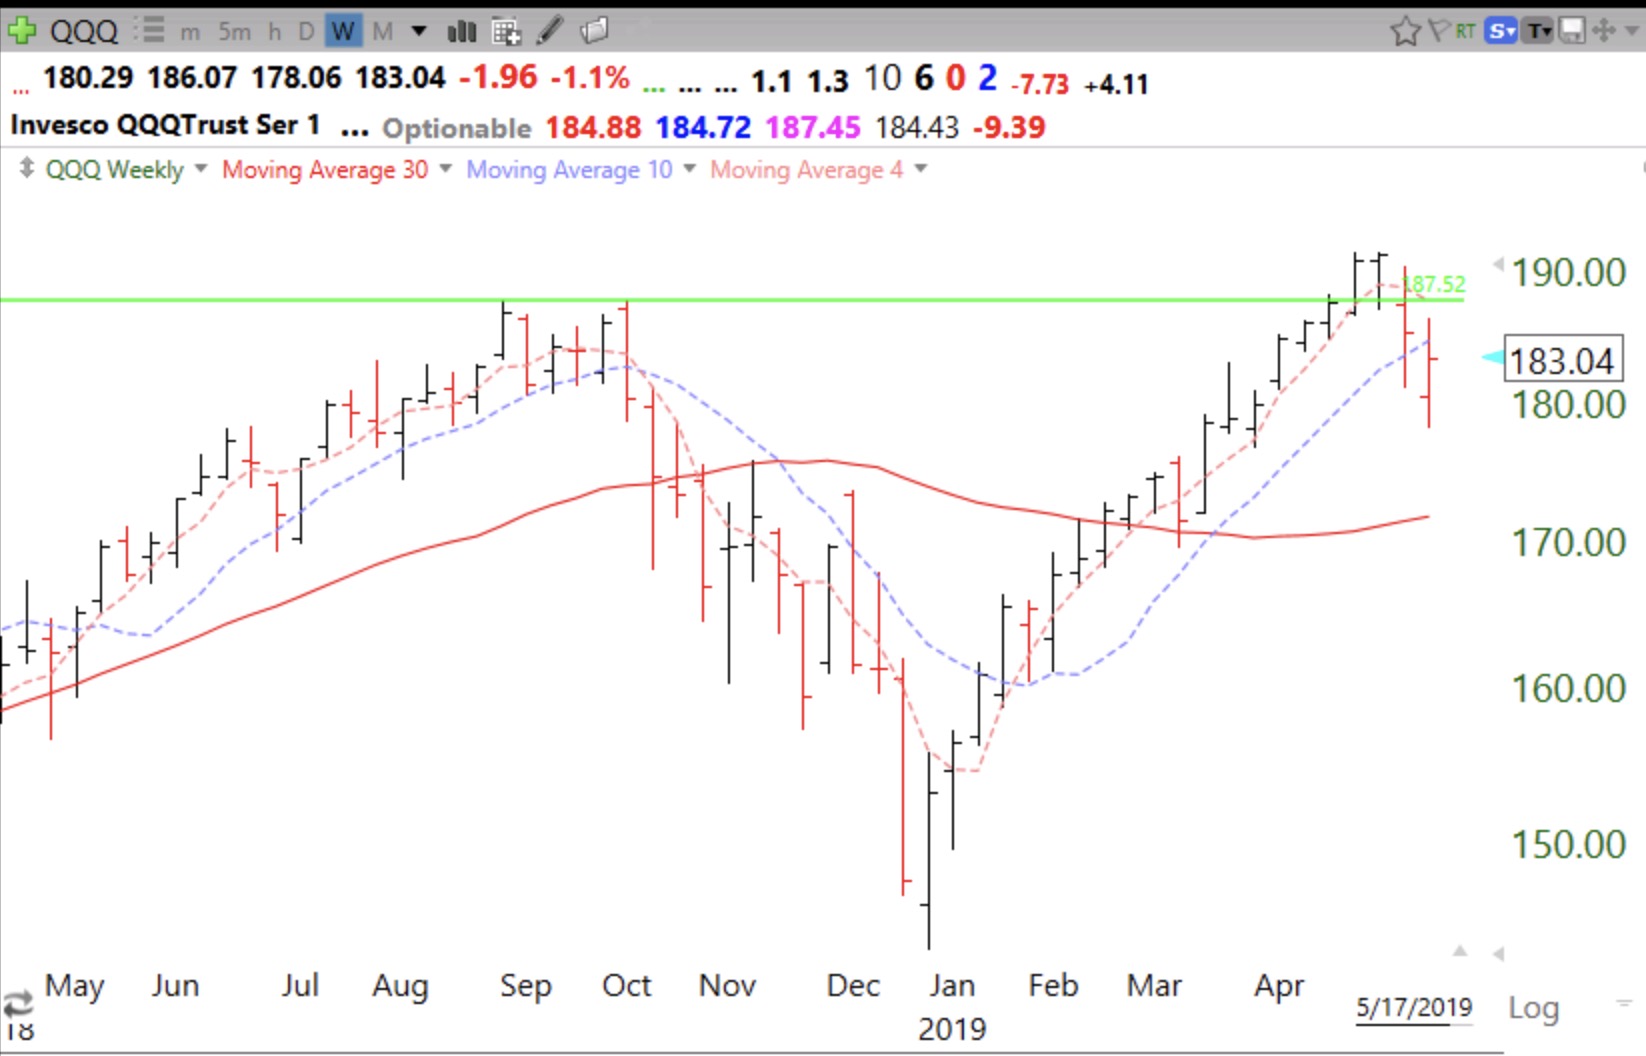
10 week average is purple dotted line in this weekly chart. The major bullish sign here is the fact that the 30 week average (red line) is turning up. However, it still looks like a failed GLB and a possible double top.
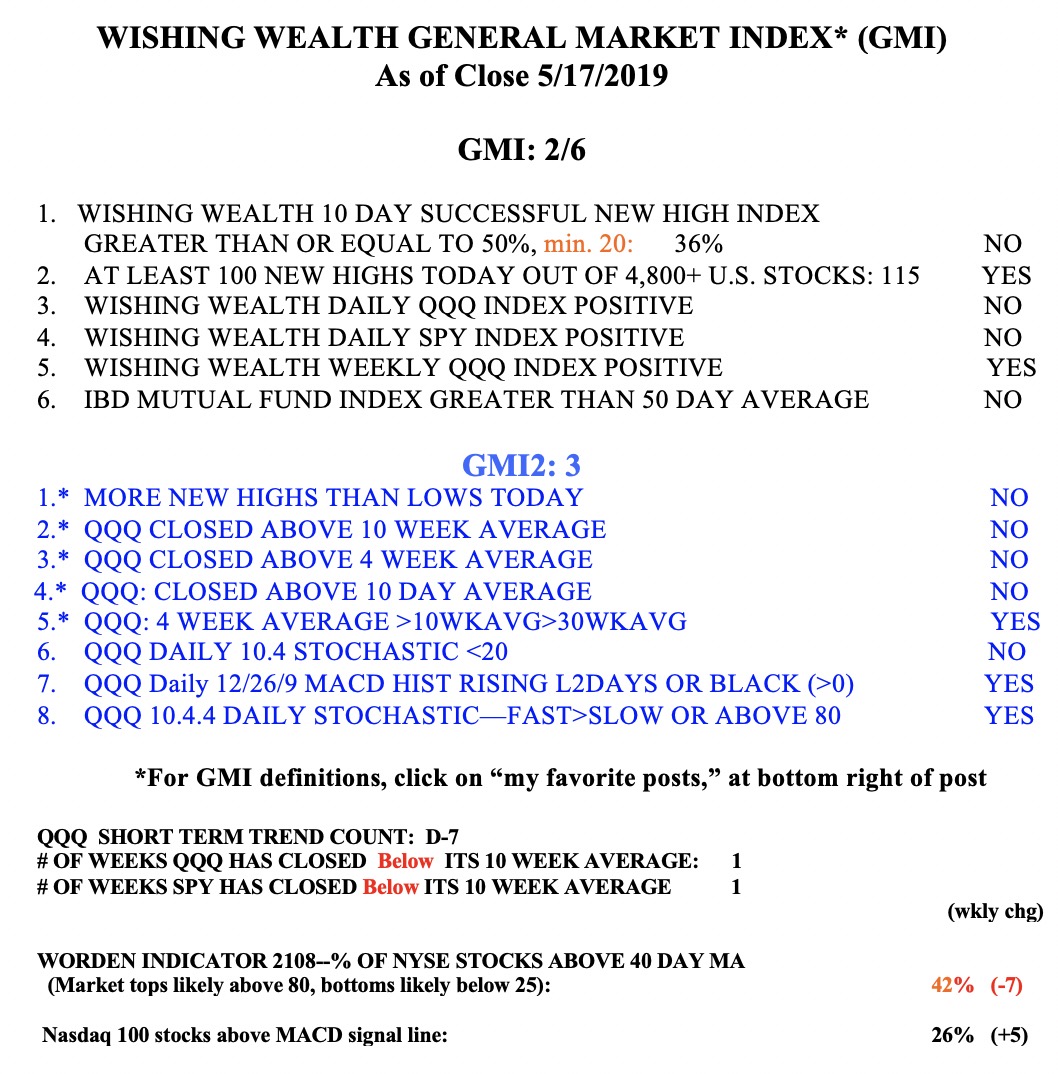
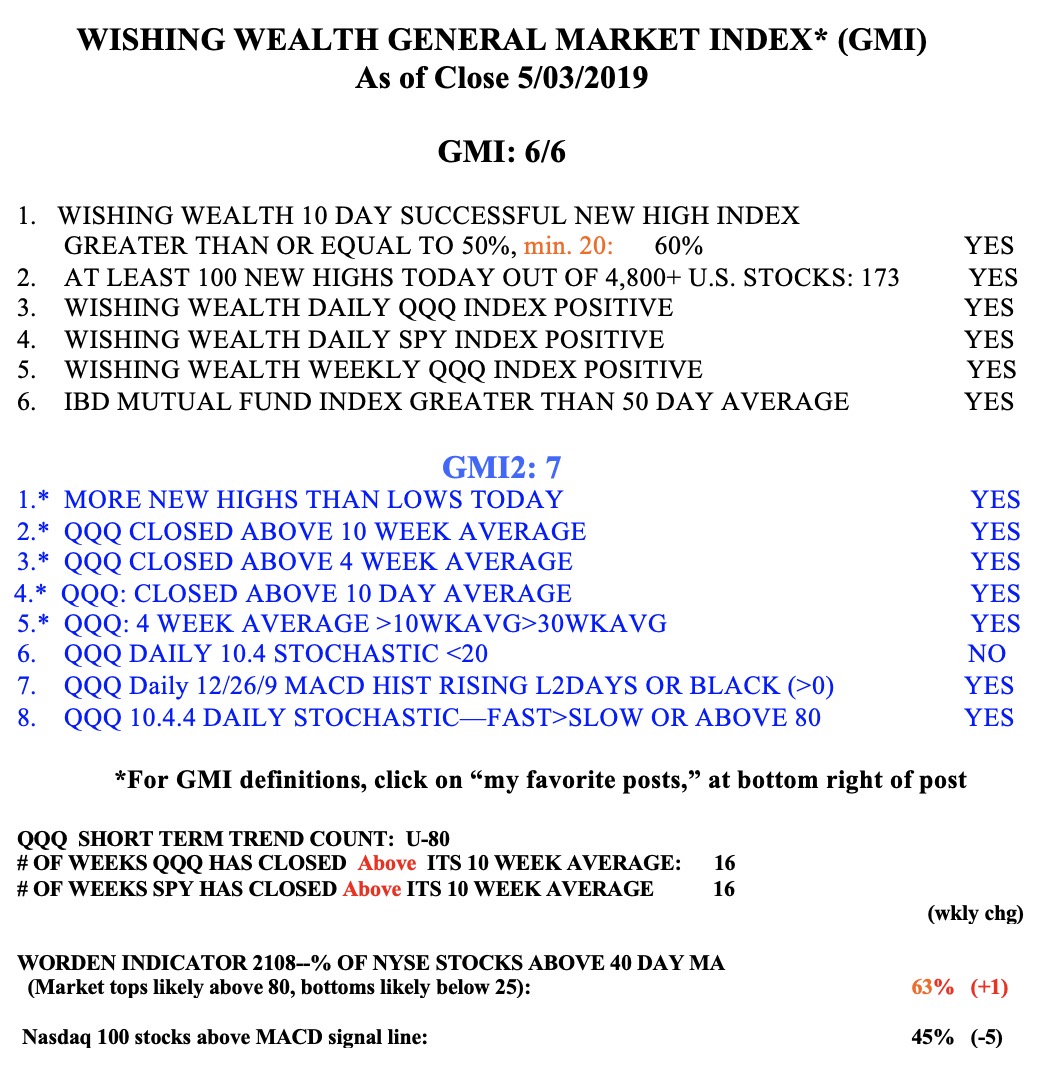
The GMI remains on a Red signal.