Will not be posting again until Monday night.
Stock Market Technical Indicators & Analysis
Will not be posting again until Monday night.
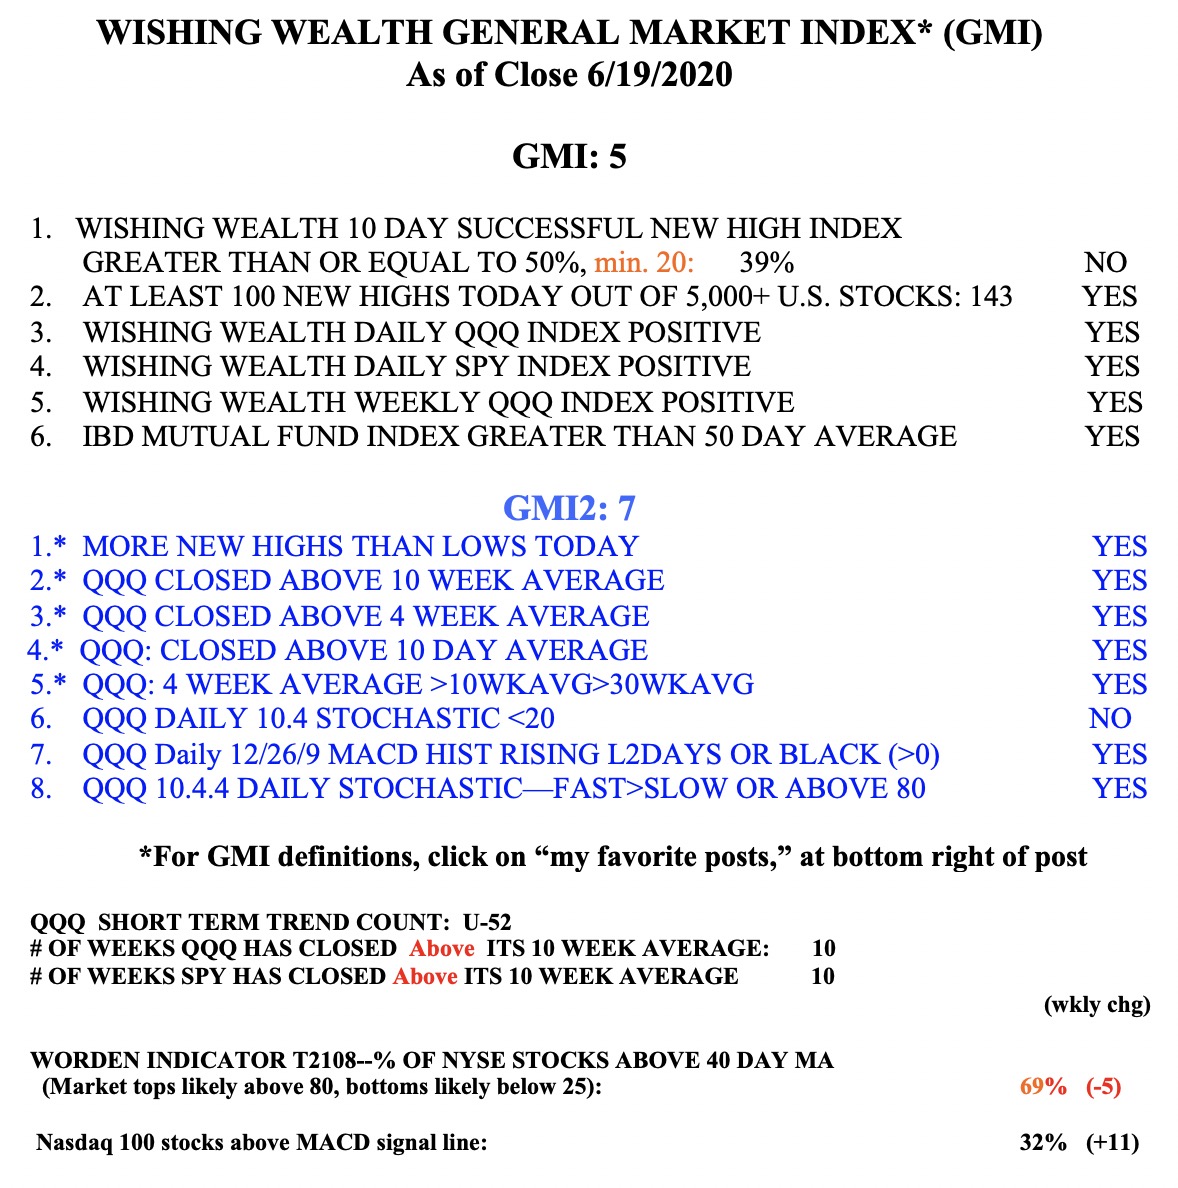
Note that the QQQ closed the week right on its 4 week average (pink dotted line) and on the precipice. There is no reason to be brave here with the futures predicting a swoon at the open. Failure to hold the GLB was a serious sign of technical weakness and could be a double top. Went to cash in my trading account and hold some SQQQ.
But we are still in a daily RWB up-trend.
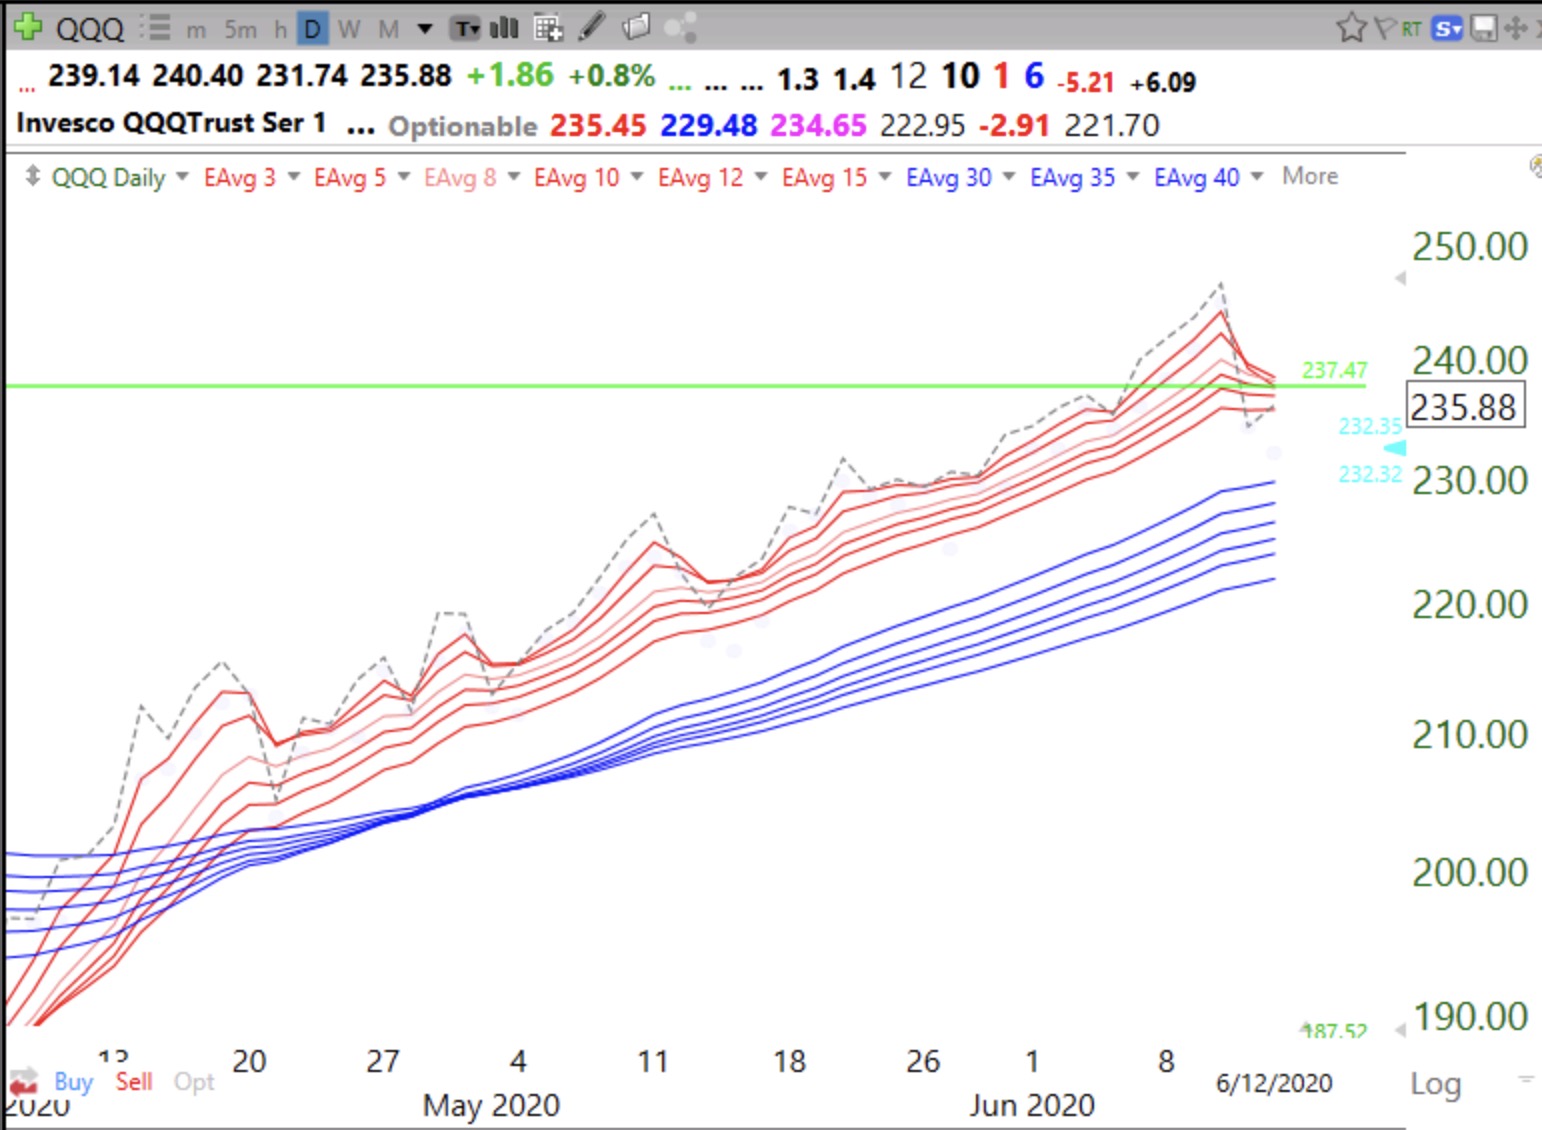
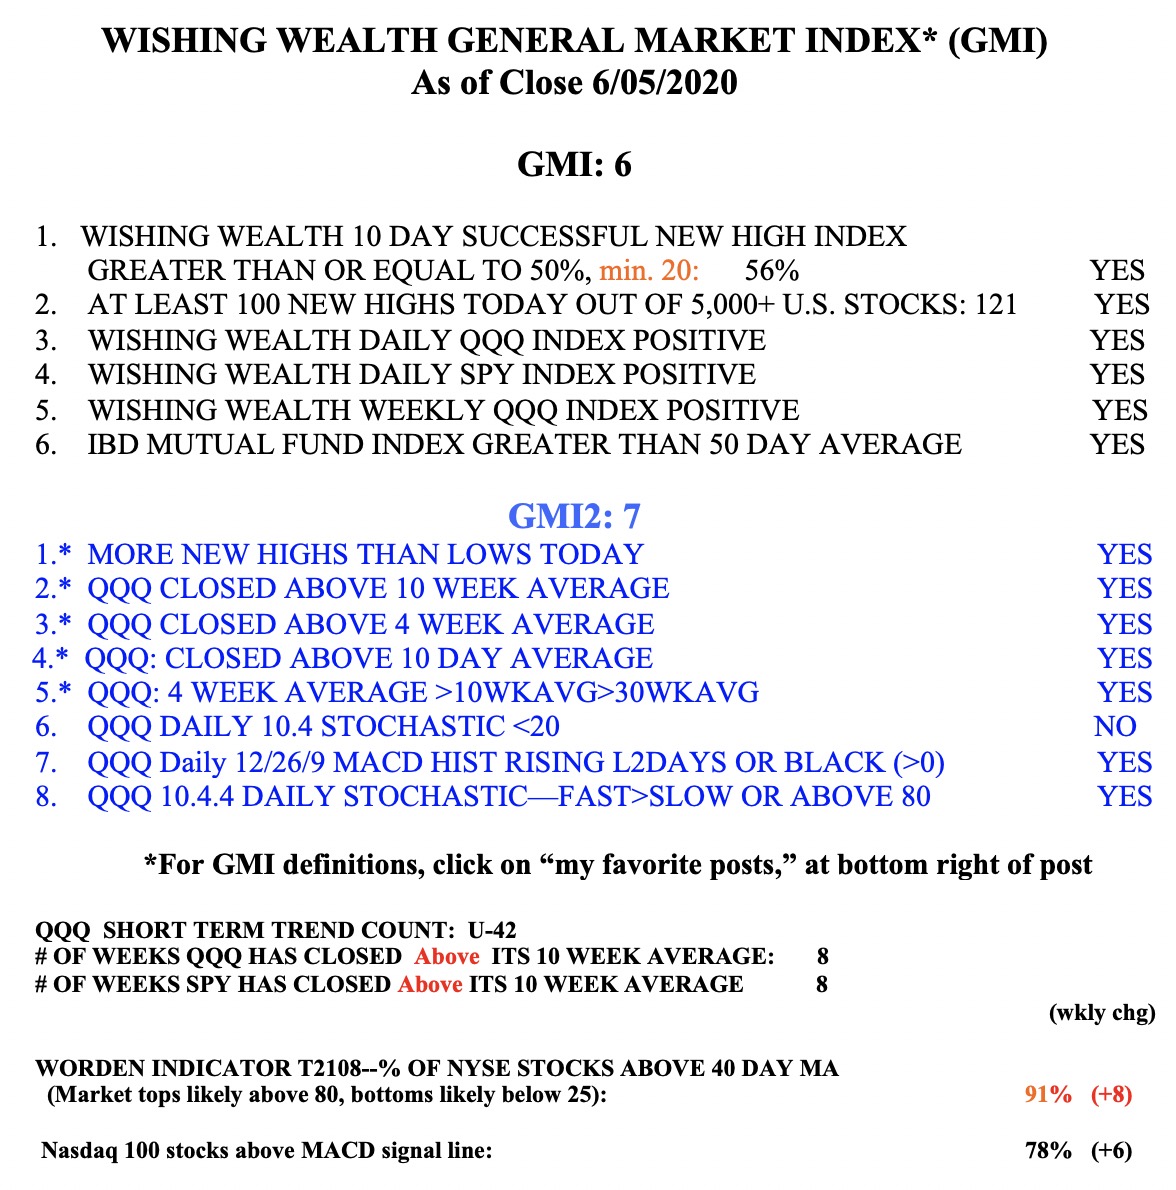
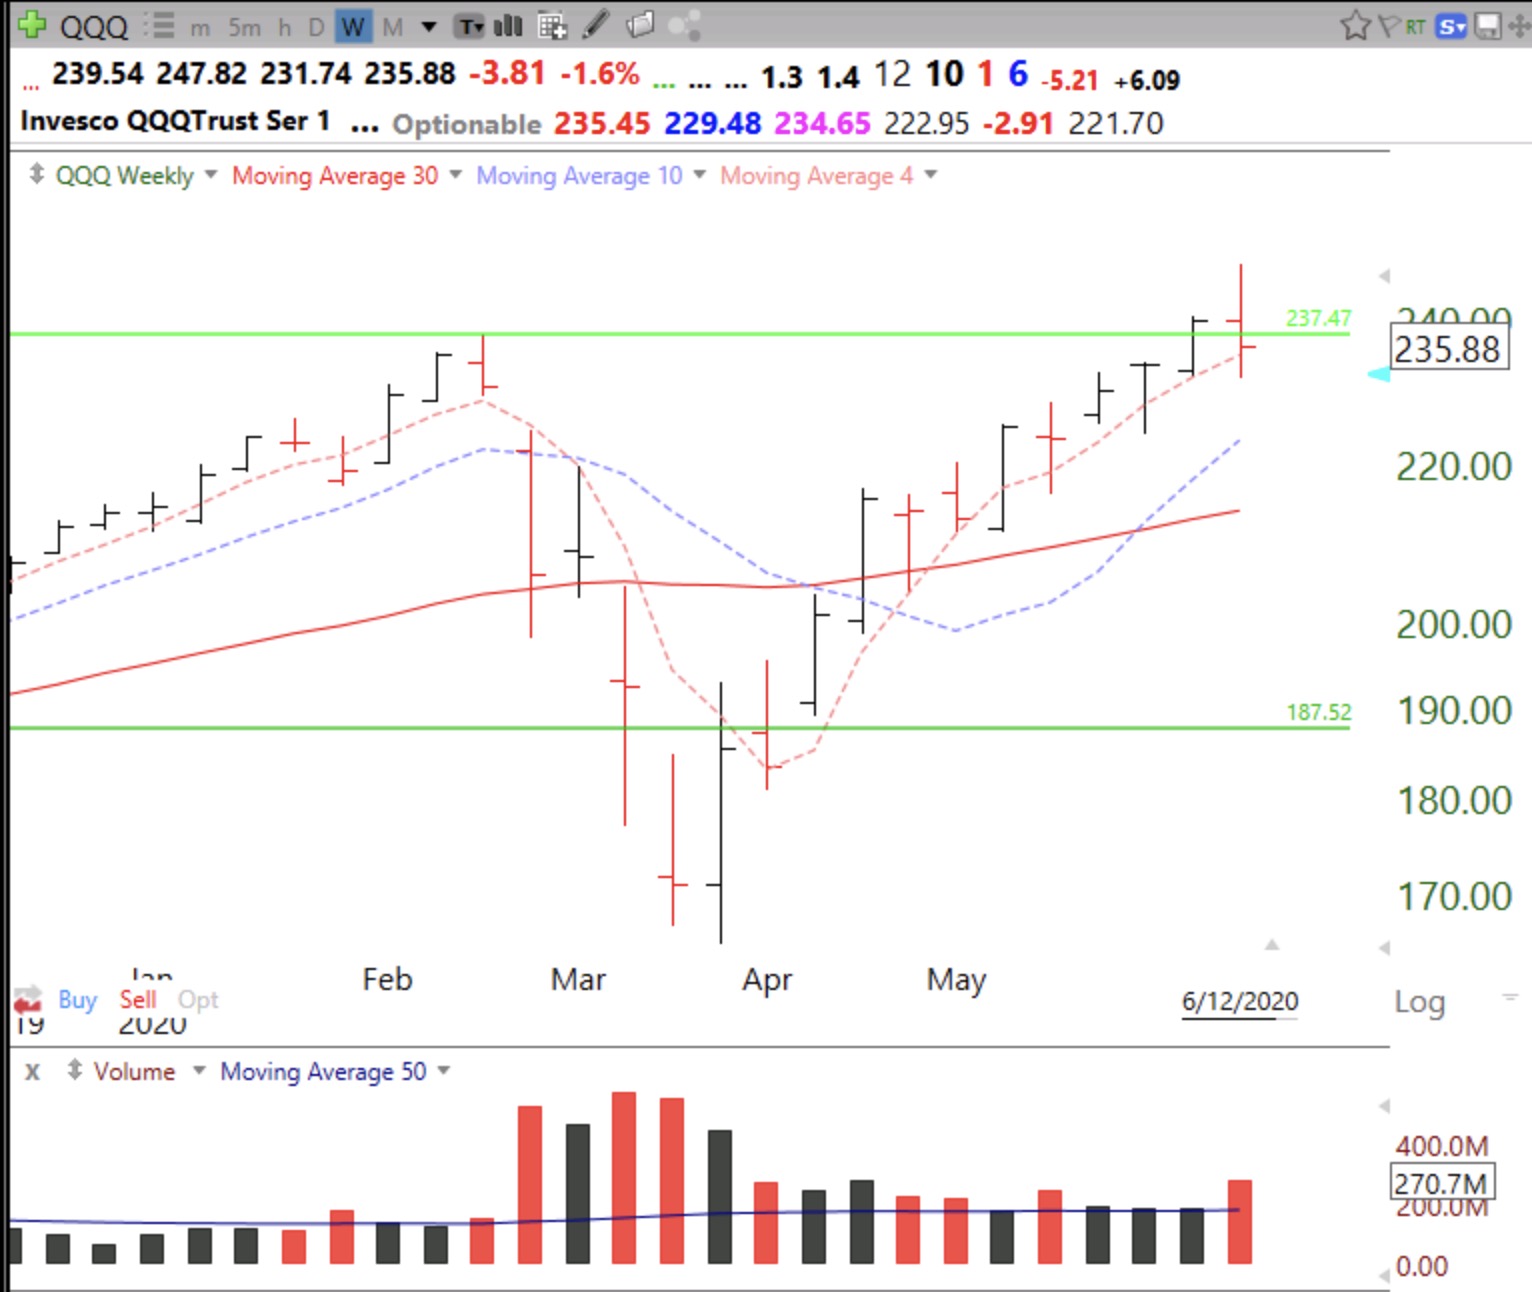
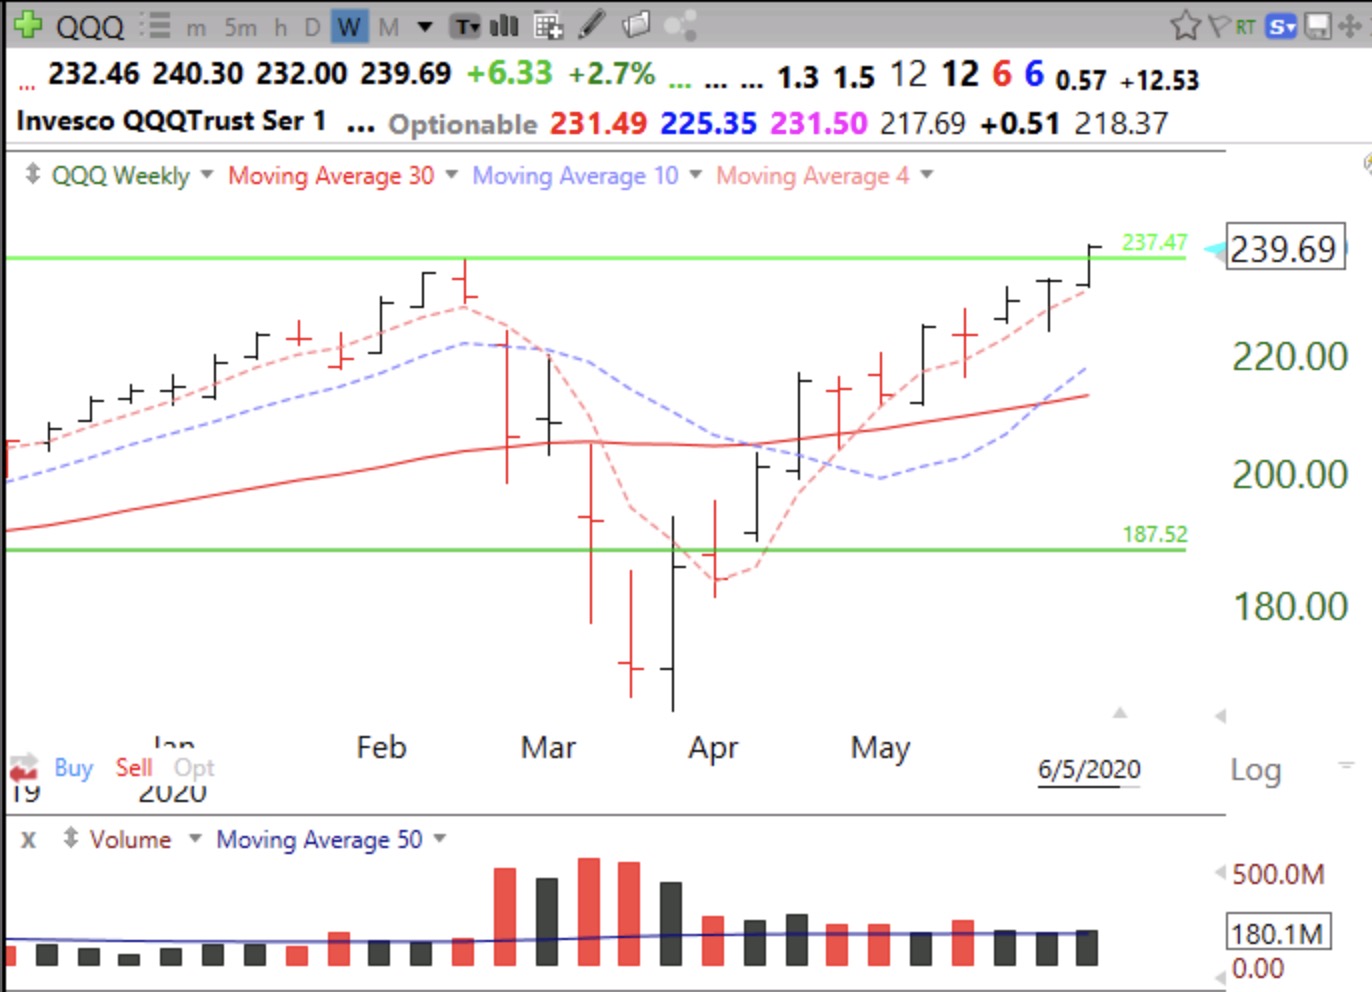
Friday was 42nd day of the $QQQ short term up-trend. T2108 is about as high as it gets, but does not signal tops, only bottoms. Very important that QQQ hold its green line, at 237.47. Note that QQQ has closed above its 4 week average (pink dotted line) for 10 straight weeks. A weekly close below that average could indicate weakening of this strong up-trend.
GMI remains Green and at 6 (of 6).