I will post next on 1/18. Have a great week.
Stock Market Technical Indicators & Analysis
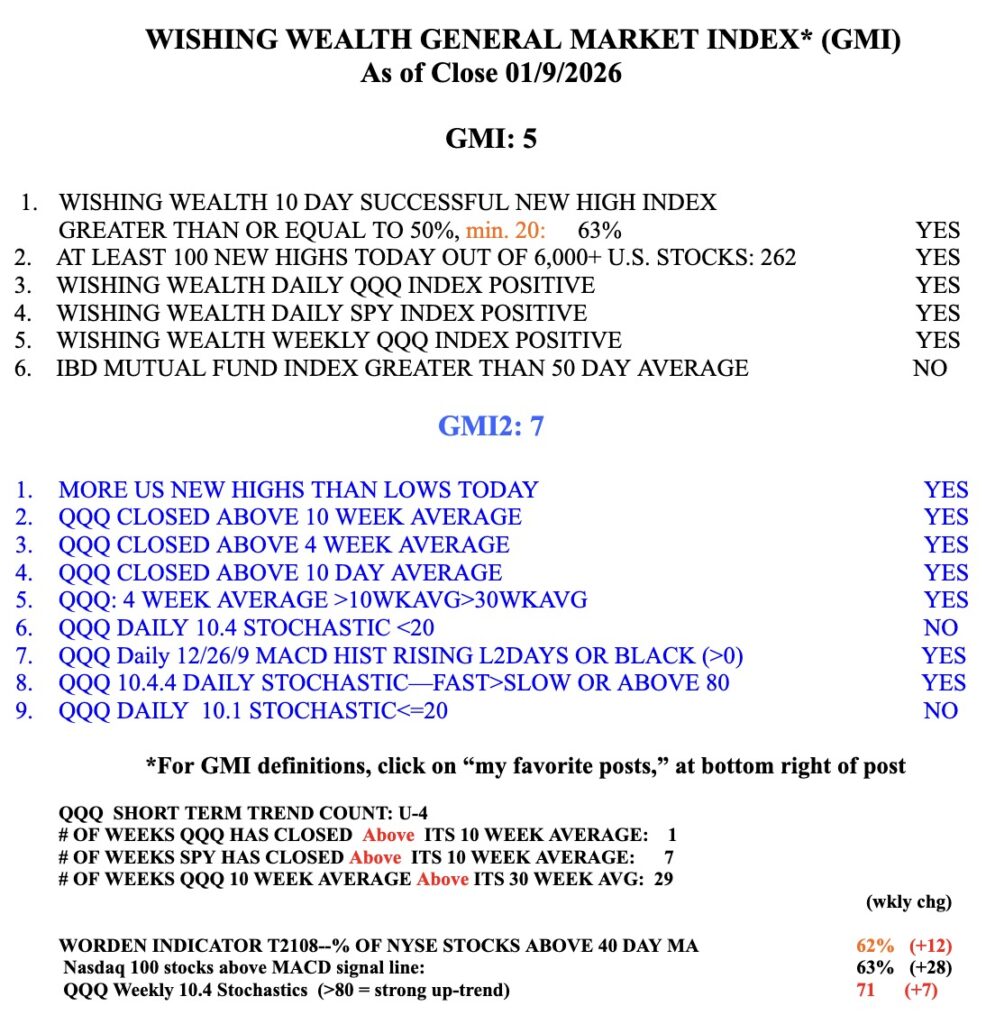
QQQ has now closed below its 10 week average.


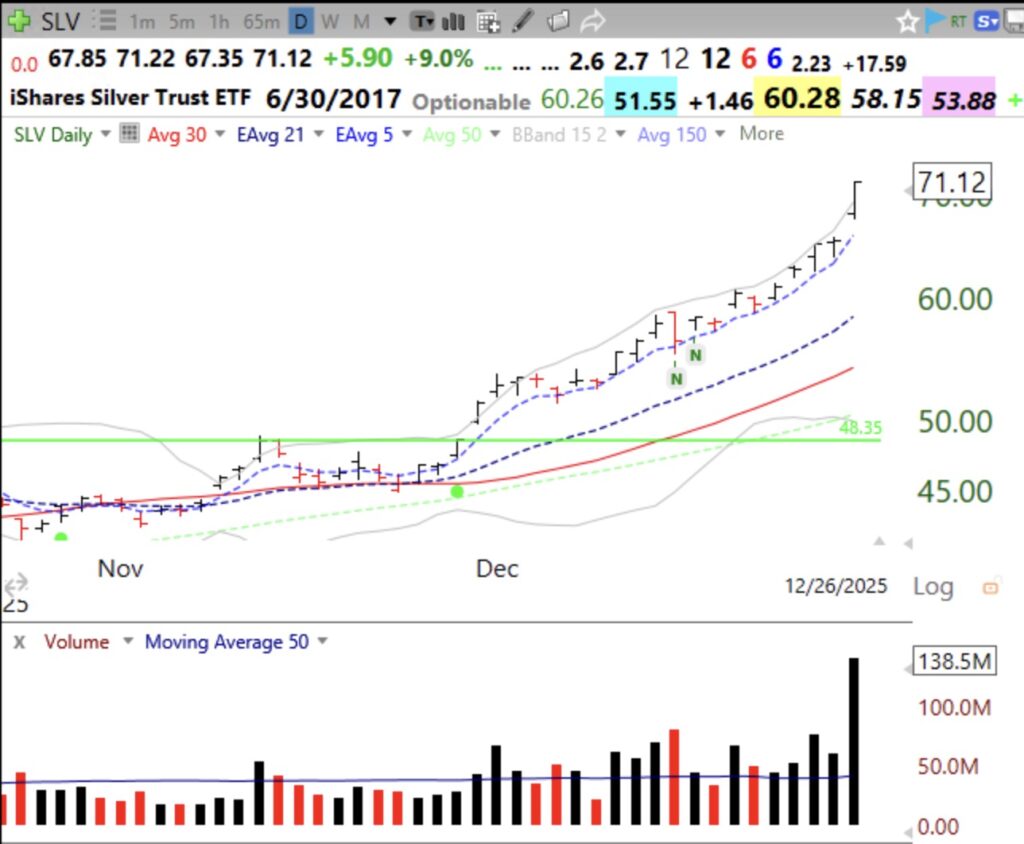
Many years ago I learned when a stock I owned went vertical and my internal voice said, “this is too easy,” it often meant the stock was having a final climax run. SLV appears that way to me. On Friday it zoomed on the highest trading volume in a long time. This daily chart shows that SLV has closed above its rising 5 EMA (blue dotted line) for 20 consecutive days after its GLB!!!! Social media is filled with posts about silver and gold. Is this too easy? We need to be careful.
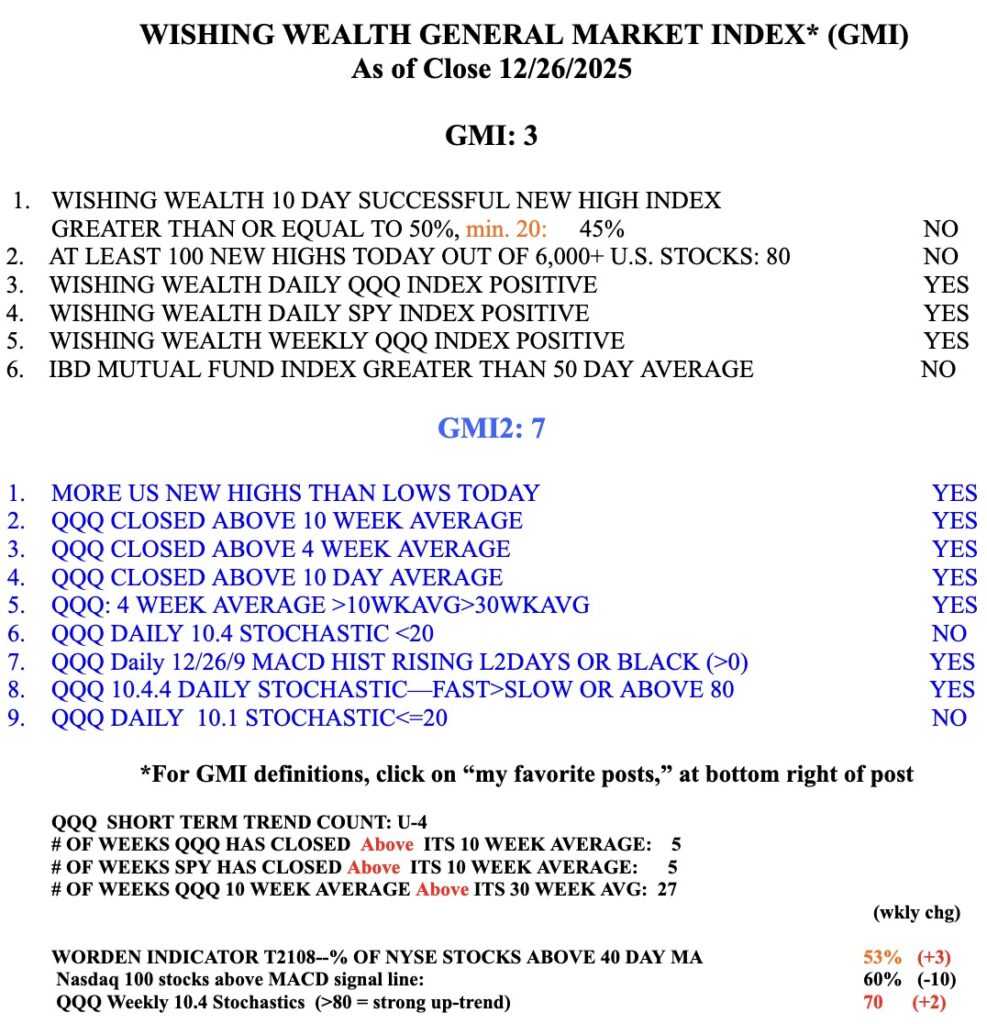
The GMI is 3 (of 6), reflecting the fact that fewer stocks are hitting new highs. But it is still GREEN.