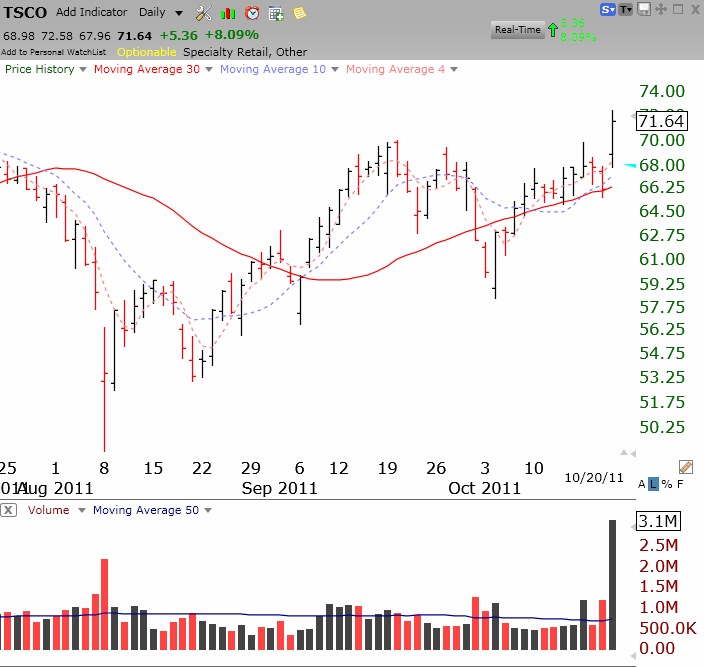
GMI-2 falls to 3 but short and longer term trends remain up. Yesterday, one of my students identified TSCO as a cup-with-handle break out. Check out this high volume break-out.
Stock Market Technical Indicators & Analysis
GMI-2 falls to 3 but short and longer term trends remain up. Yesterday, one of my students identified TSCO as a cup-with-handle break out. Check out this high volume break-out.
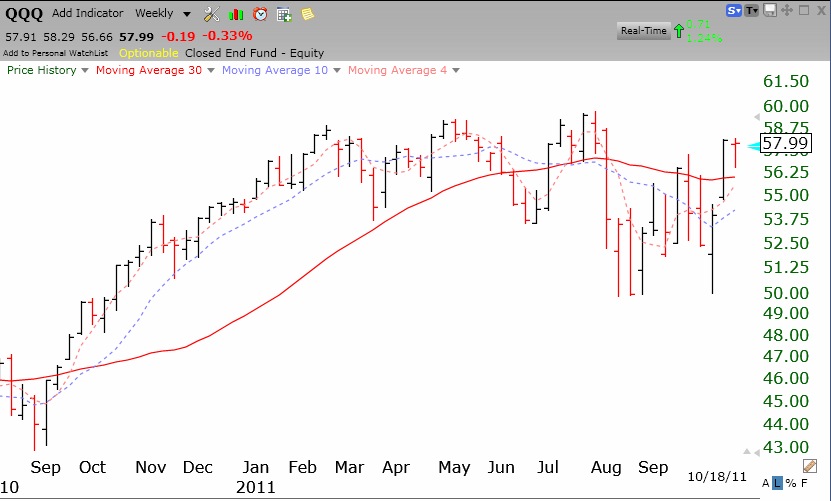
In spite of the AAPL decline, it looks to me that the QQQ is in the beginning of an up-turn. A close of the QQQ below 56 would change my assessment. Meanwhile, GLD would appear to be topping if it closes below 156.
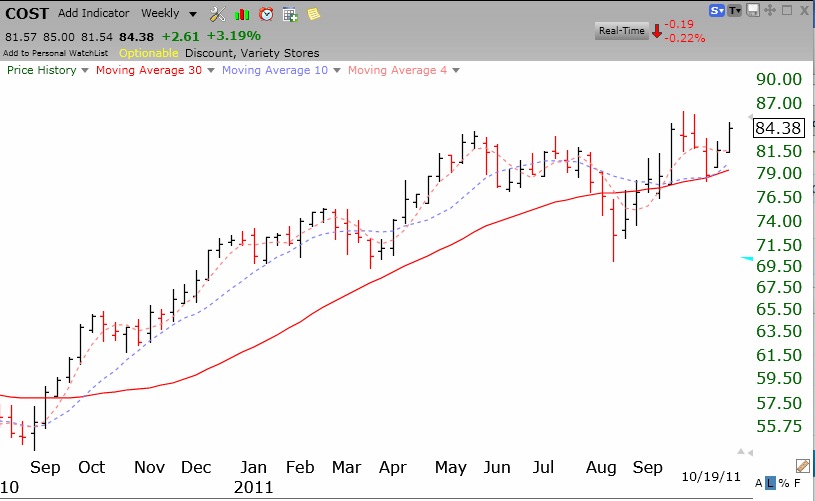
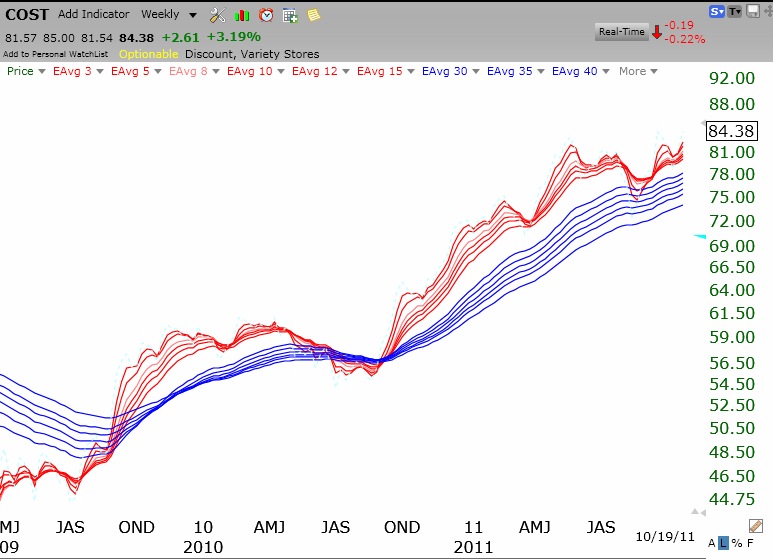
COST (Costco) appears to be in a strong Stage 2 up-trend, as long as it remains above $79. (Click on chart to enlarge.) The weekly GMMA shows it to be an RWB stock and emerging from a base. I own COST.
Market indexes appear to be turning up. The QQQ has retaken its 30 week average (red solid line). We may be at the beginning of a new Stage 2 advance. (Click on chart to enlarge.)