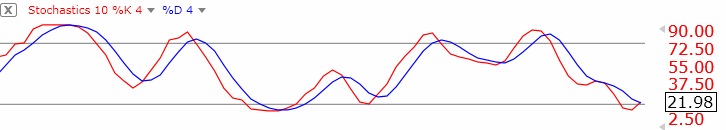
The QQQ has held the August lows for now. The one tip off that the market might bounce is that the daily 10.4.4 stochastic registered the same oversold level that it did during the two bounces in August. See this daily chart.
Stock Market Technical Indicators & Analysis
The QQQ has held the August lows for now. The one tip off that the market might bounce is that the daily 10.4.4 stochastic registered the same oversold level that it did during the two bounces in August. See this daily chart.
Major indexes remain in short and longer term down-trends. On the sidelines in cash.
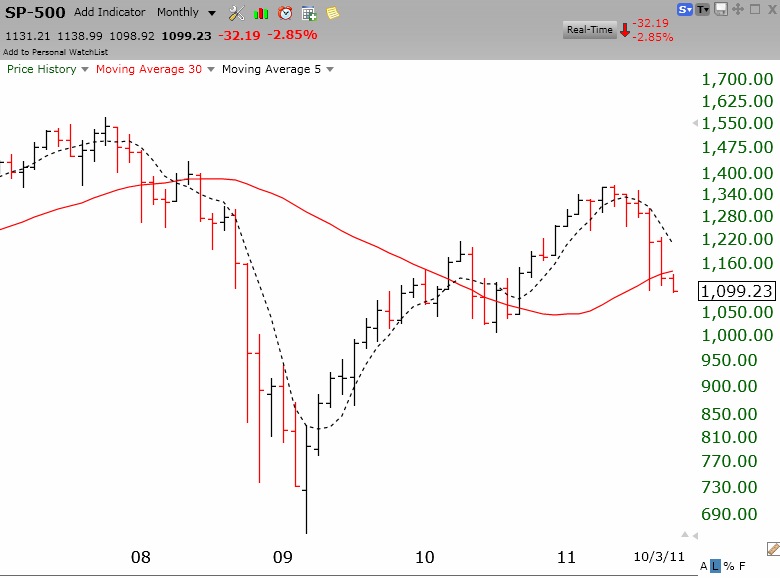
With the GMI and GMI-2 both at zero, it is a good time to be in cash. Note that the T2108, at 15%, is getting back into oversold territory. It bottomed in August at 7%. Both the DIA and SPY have now closed at their August lows. The QQQ is still above its August low. With AAPL finally breaking down below its 10 week average, the bear may be almost through devouring this market. But we don’t predict, we follow the trend. And the long and short term trends are now down. WE sit back and wait to reenter this market at cheaper levels, after we get a buy signal. Nevertheless, in spite of the media hysteria about the current weak market, this monthly chart of the S&P500 Index shows that we still have had only a mild decline thus far. We remain above the 2010 consolidation lows. Click on chart to enlarge.