All Posts
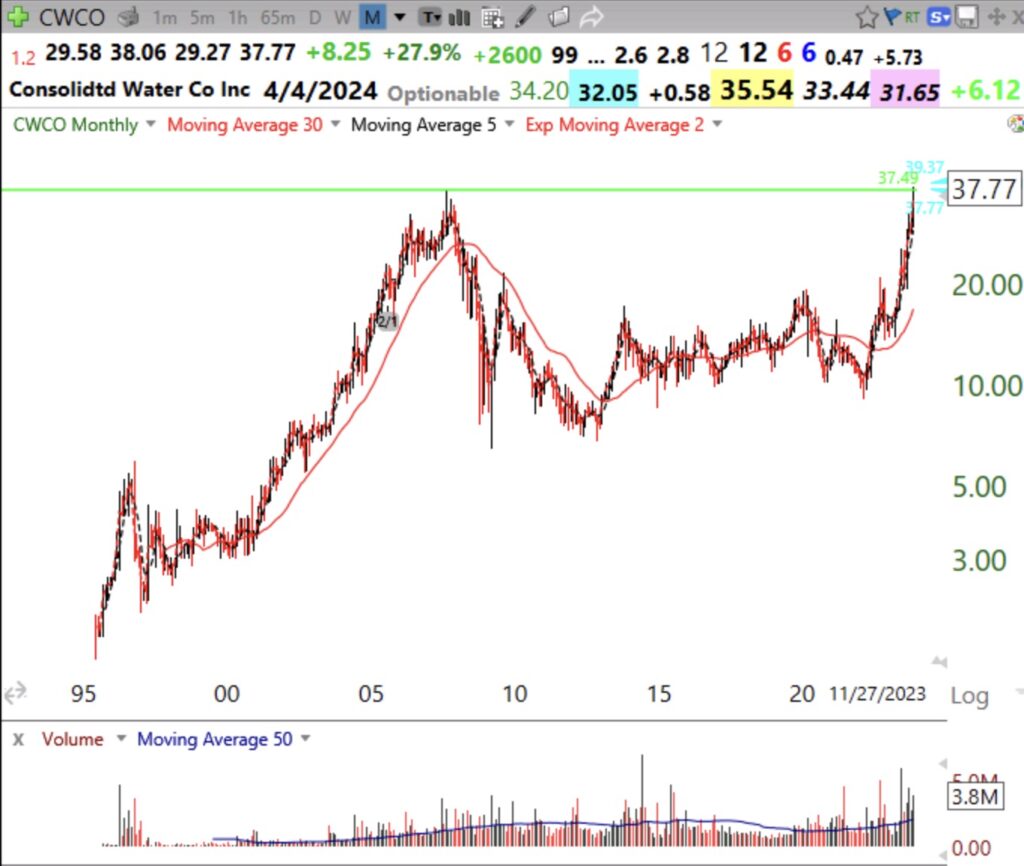
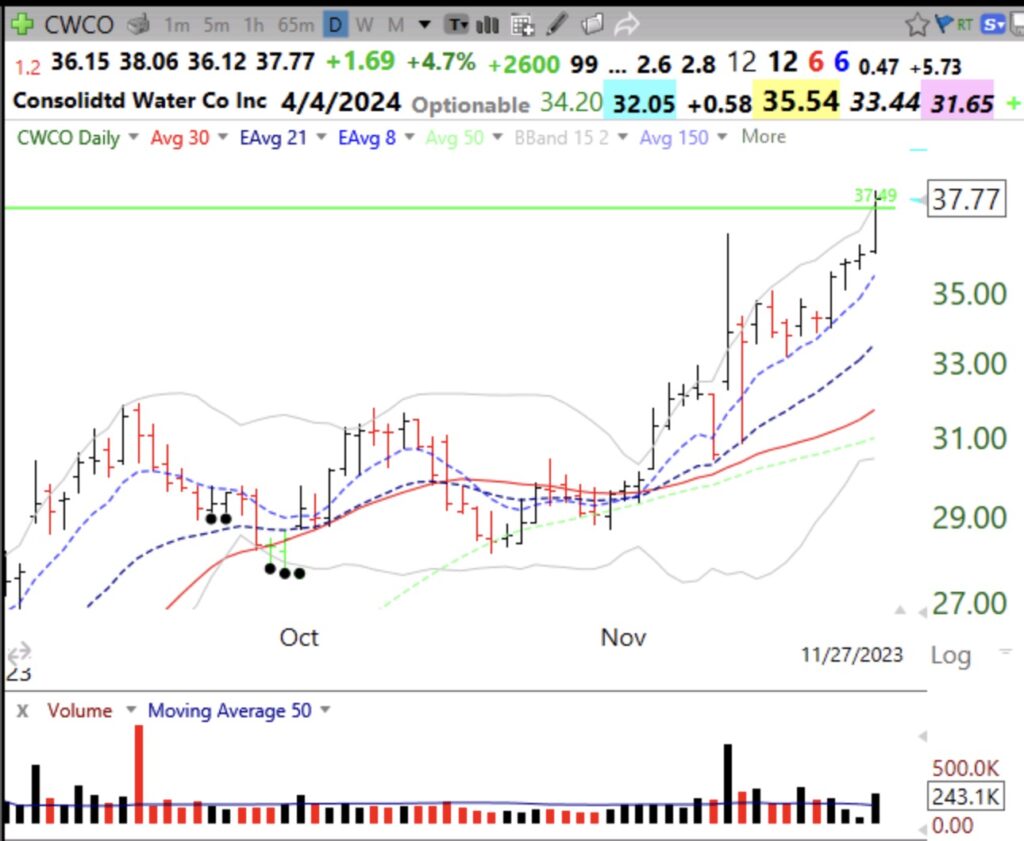
Blog Post: Day 16 of $QQQ short term up-trend; 6 Stocks having a recent GLB to an ATH: $CWCO, $GDDY, $SKX, $V, $L, $BRO; $CWCO breaks ATH peak from 2007 on above average volume, IBD/MS Comp=99, see monthly and daily charts.
In addition to its GLB today, CWCO caught my eye because it is expected to have earnings in 2023 up +220%. It has also almost tripled its yearly low. MS Accum/Dist rating=A+. Someone is accumulating this stock. Maybe there is a future in seawater desalination? It must not close back below the green line, at 37.49. If it does, that would be a failed GLB and I would sell immediately. If that happens I would buy it back if it closes back above its green line. Note the above average volume up days (black bars) recently on the daily chart.


