I went to cash in my trading accounts on Thursday. It is very unusual to have a GMI of 5 and to still be in a QQQ short term down-trend. And now the GMI has fallen to 3. One more day below 4 will turn the GMI signal to sell. With the jobs report coming out on Friday morning, I found it better to retreat to the sidelines. Too many leaders are weakening. IBD considers the up-trend to be under pressure.
All Posts
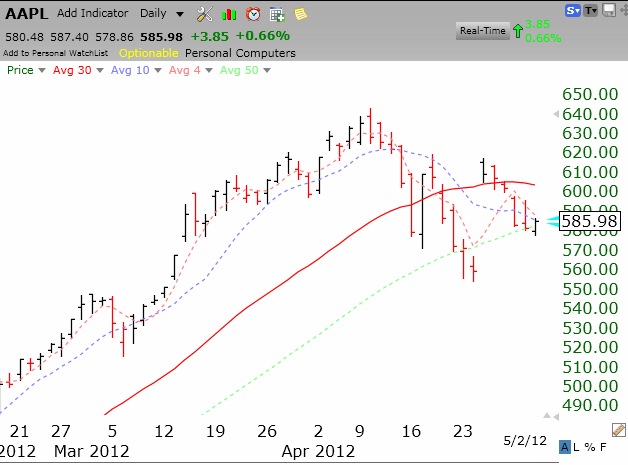
Cautiously long; AAPL stalled
With the 30 day average of the QQQ remaining flat, I am only a little long in my trading accounts. Friday could be a volatile day, with the release of the jobs report and I am not taking many chances. I am also concerned that the market leader, AAPL, has stalled after releasing terrific earnings. Click on daily chart of AAPL to enlarge.
QQQ short term trend still down
While the GMI still indicates a buy signal, the QQQ short term trend is still down and its moving average is flat and therefore prone to whip-saws. I am only cautiously bullish.