With the T2108 at 78% I am getting a little worried about a near term top. 50% of the Dow 30 stocks have an overbought stochastic. Similarly, so do the indexes, DIA and SPY, but not the QQQ. Techs are relatively weak. Are the techs signalling a coming decline in the other stocks? September and October are typically weak months for the market. I am very cautious for now. The GMI2 is now down to 4.
All Posts
29th day of QQQ short term up-trend; AAPL’s week
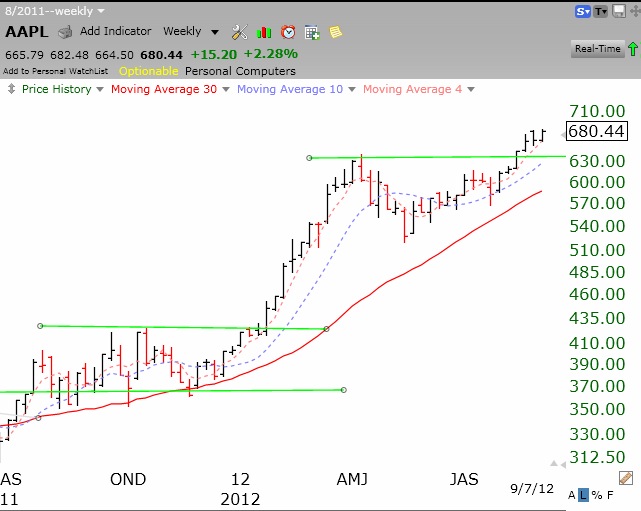
Both the GMI and GMI2 are at their maximum readings. 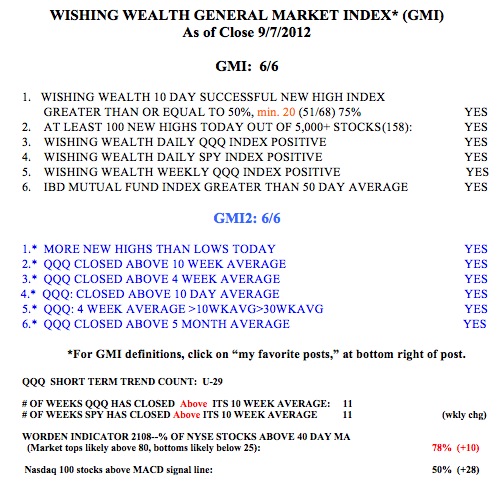 The GMI buy signal of July 30 remains in effect. 50% of the Nasdaq 100 stocks have now closed with their MACD above its signal line, a sign of short term strength. However, the Worden T2108 indicator is now at 78%, very close to extreme overbought territory. This week AAPL announces the new iphone 5. The reaction to the announcement will be very interesting to watch and may provide an indication of the health of the market, at least with regard to tech stocks. This weekly chart of AAPL shows how nicely AAPL has progressed since breaking a green line top to an all-time high a few weeks ago. Click on chart to enlarge.