Slowly adding to TQQQ and other break-out stocks.
All Posts
Market up-trend continues; Green line break-out with cup and handle: TRIP
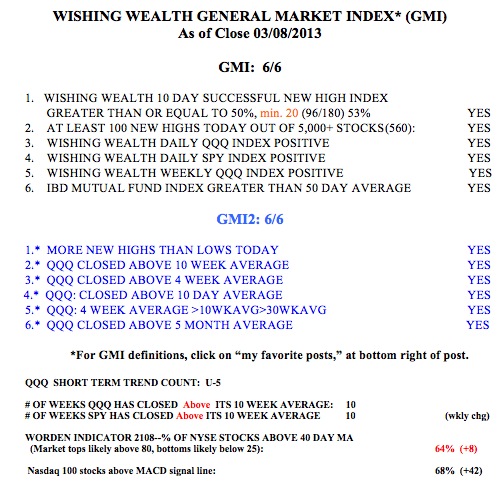
I introduced the concept of green line charts a while ago. I draw a green line when a stock on a monthly chart hits an all-time high which is not closed above for three months. I then wait for the stock to break through the green line top to a new all-time high. Rocket stocks form a set of green line tops. They rise to a peak, consolidate for a few months and then burst through to a new high. The idea is to buy a little at the break-out and to add more as long as the stock does not retreat back below the most recent green line. So, each evening I run a TC 2000 scan for a list of stocks that hit all-time highs and then draw in the last green line top on each stock. If the stock has recently (within a week or two) broken out above a green line, I research it further for a potential buy, as long as the market remains in an up-trend. With the GMI at 6 (see table below) , I am looking for green line break-out stocks to buy.
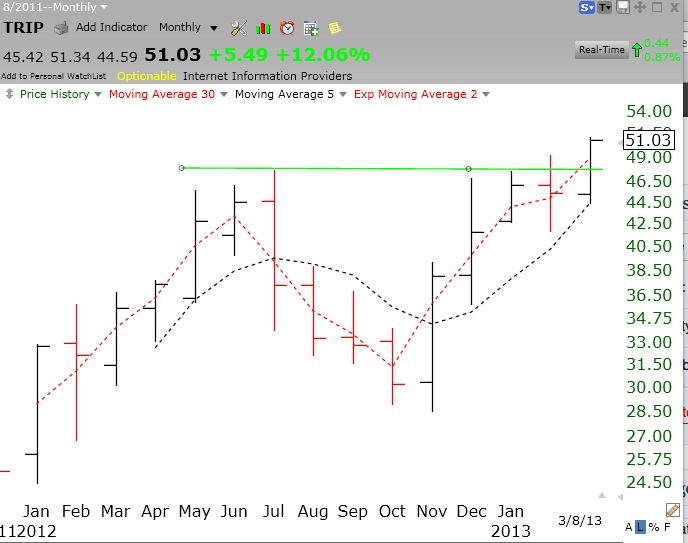
On Friday, TRIP came up in my daily new high scan. The monthly chart below shows that TRIP has broken above its green line top this month. It is also a relatively recent IPO, having come public in December, 2011.
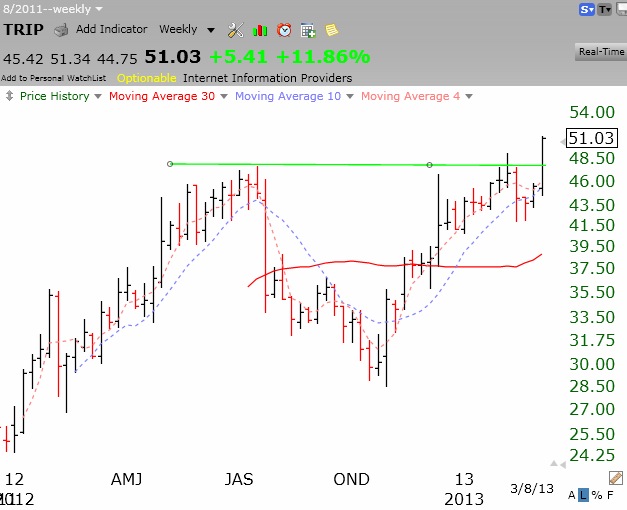
The weekly chart below shows the green line I drew on the monthly chart. It looks like TRIP has just broken out of a cup with handle pattern on above average volume (not shown), another sign of strength.
With an IBD Composite Rating of 99, TRIP is a stock I might buy on Monday.