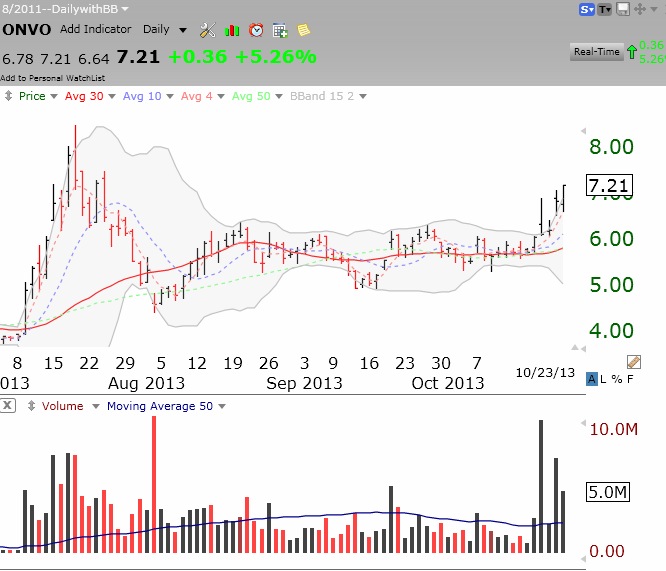
I have been writing about ONVO since January 18, when it was around $4.28. It is the primary company in the area of 3D printing of human tissues. While ONVO is very speculative, I hold a small position in case it is successful. There is a lot of volume coming into it of late because of some terrific liver test results recently released. Note the huge daily up volume recently and the Bollinger Band break-out. Click on chart to expand.
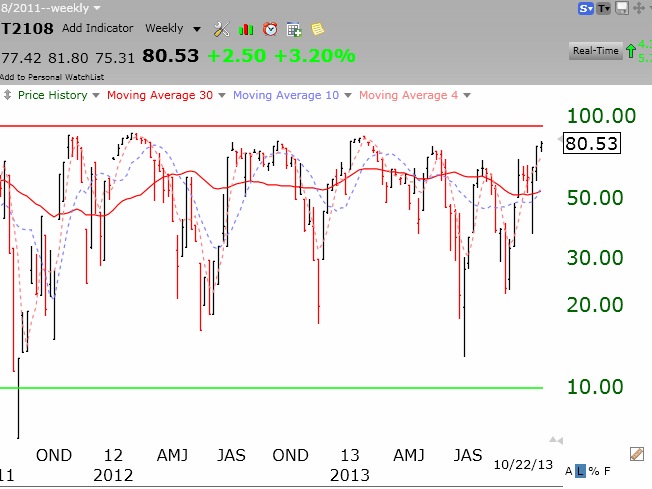
 For the past two years the Dark Liquidity site has been tracking the performance of the GMI compared with other strategies. The strategy that uses the GMI to buy and sell the leveraged 2X QQQ ETF has consistently beaten all other strategies. Check out the GMI components and the buy and sell signals there too. A link to the site (http://dark-liquidity.com/) also appears to the lower right of my site. I use the GMI to time positions in the 3X QQQ ETF, TQQQ. Past performance is no guarantee of future performance, but it has worked prospectively for me.