Dotted line = 10 week average. Gray line = weekly close. Red line= 30 week average.


Stock Market Technical Indicators & Analysis
Dotted line = 10 week average. Gray line = weekly close. Red line= 30 week average.
On Day 1 of a new short term up-trend it is very difficult psychologically to go long immediately because the market, by definition, had recently been declining. It is tempting to drive with one’s hands on the rear view mirror instead of the steering wheel. So I will add a little TQQQ and accumulate more if the new up-trend persists. In a long up-trend TQQQ beats more than 95% of individual stocks. Search my blog for the evidence. About 20% of new short term up-trends end within 5 days. But the GMI table below also shows many promising signs. With the GMI=6, it will likely flash a GREEN signal on Tuesday. I will be without a computer this week and will still try to tweet out if there is a change in the short term trend. Some time for a vacation before my fall class. Sign up to get my tweets on X, @wishingwealth.

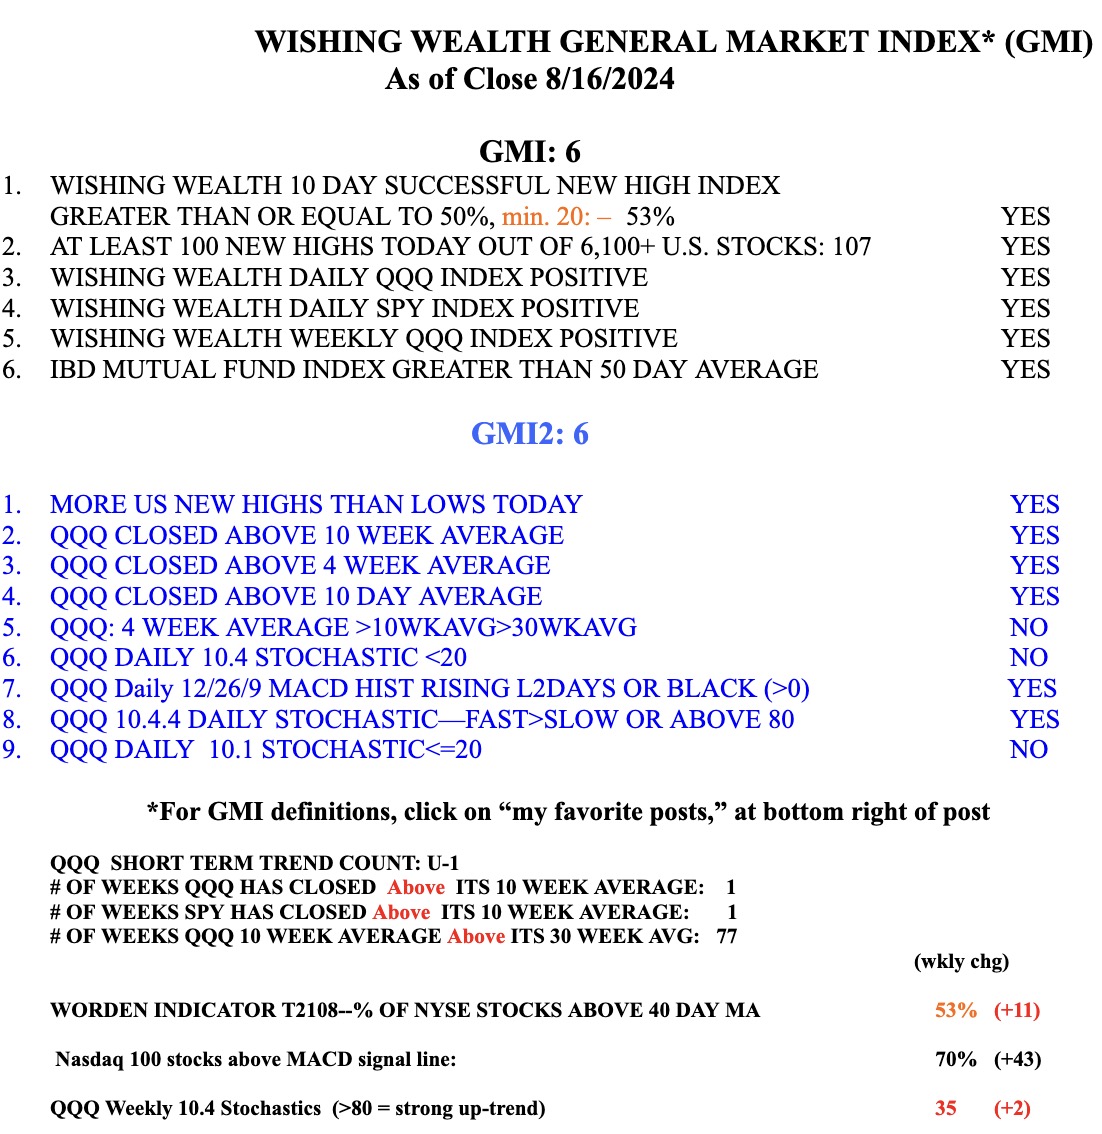
Note that the MACD histogram has turned blue (positive).
