Blog Post: Small-cap stocks have likely formed a bottom and started to advance, check out these weekly and daily charts for $IWM and $TNA, https://wp.me/pqq9l-6Lr

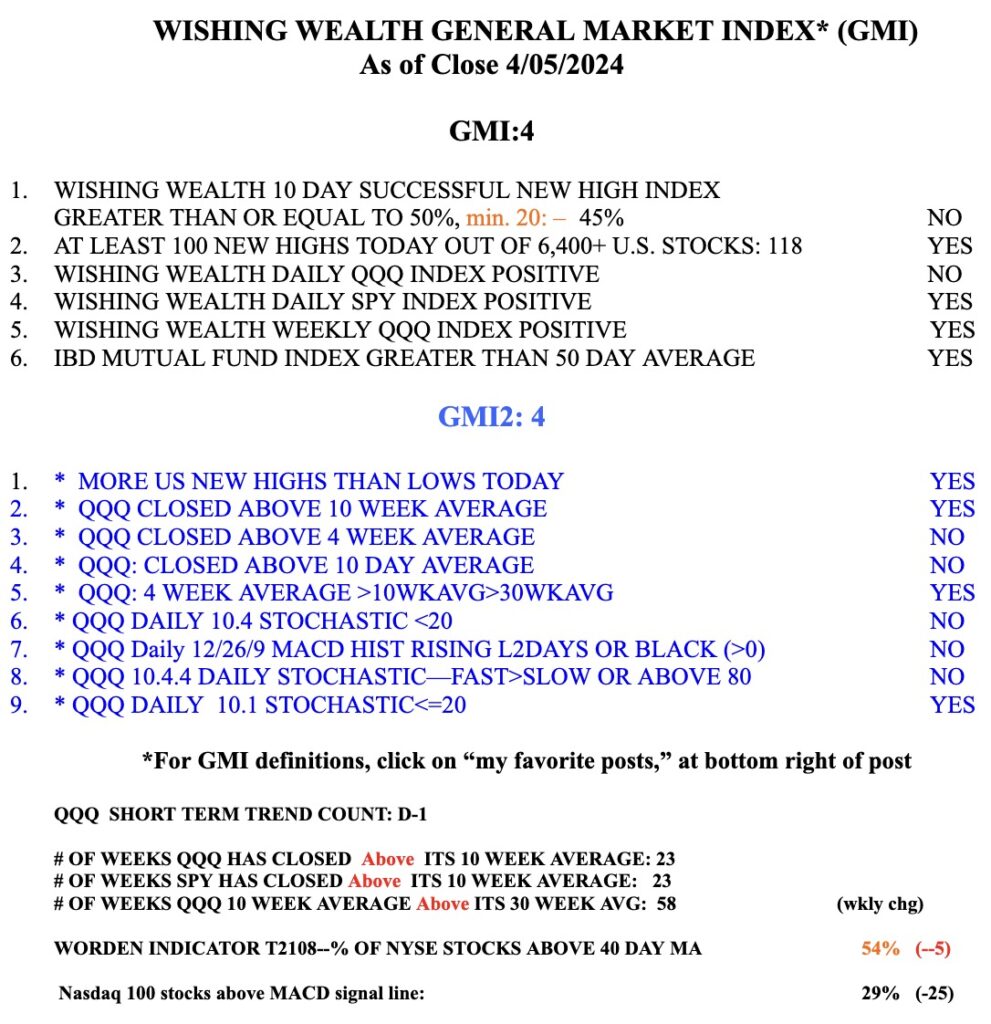
GMI6/6
GMI-27/9
T210858%

TNA is the triple leveraged bullish ETF for IWM, the Russell 2000 index ETF. I prefer to trade TNA, like I trade TQQQ when QQQ is in an up-trend.  TNA advanced +8% on Tuesday while IWM advanced +2.6%. Now that the tech stocks have moved up, it is fitting that people feel more comfortable buying the small caps. I think that IWM has formed a bottom. Do you agree? Check out these daily and weekly charts.


Blog Post: Day 24 of $QQQ short term up-trend; $QQQ is in a Stage 2 up-trend with a yellow band pattern, but may be extended, see weekly chart

GMI5/6
GMI-27/9
T210837%

I have been transferring retirement funds from money market funds back into mutual funds. QQQ is now in a strong yellow band up-trend. See this weekly chart. QQQ is above its rising 30 week average (red line) and its 10 week average (blue dotted) is rising above the 30 week average. Note the clear space (no price bars) between the 10 and 30 week averages–my yellow band pattern. I used to fill this open space with a yellow highlighter=yellow band. A yellow band pattern is the sign of a strong up-trend. However, the current week’s bar is floating above its 4 week average (pink dotted). This suggests QQQ is extended and may fall back in line with its 4 wk average. See my 2021 Trader Lion presentation for an explanation of these chart patterns. The link is at the blog tab, Webinars.