By my count, Monday was the 34th day of the current QQQ short term up-trend. The T2108 is at 45%, in neutral territory.
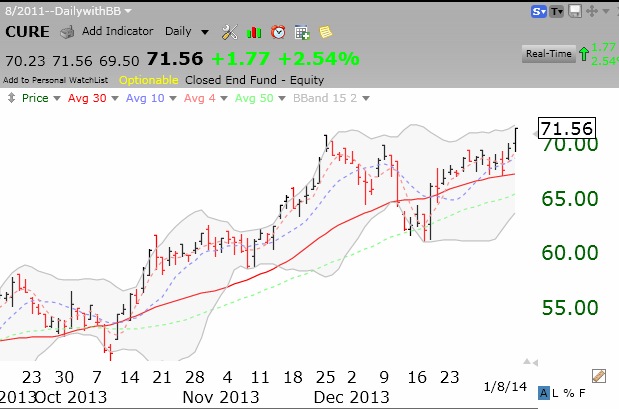
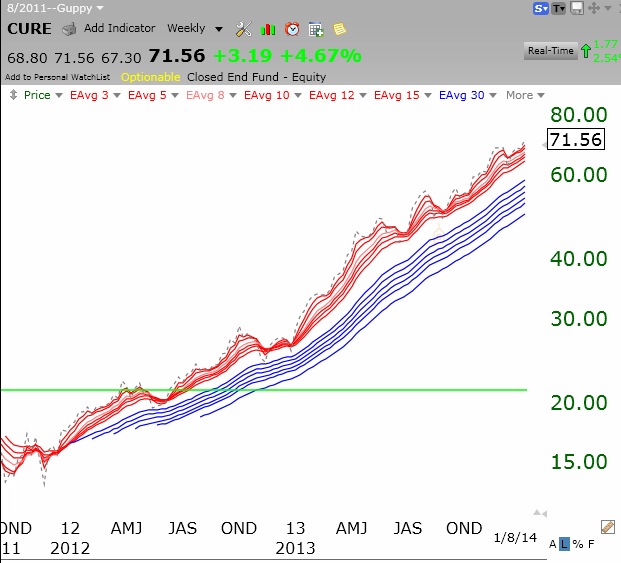
MINI, a recent green line break-out stock, may be testing support at the green line. Check out its daily chart.
Stock Market Technical Indicators & Analysis
It’s nice to be back. The GMI Buy signal remains in effect. IBD sees the up-trend under pressure. The QQQ, SPY and DIA are bouncing up off of short term support. All averages remain in strong longer term up-tends. I tune out the news and pundit hysteria and let the market tell me its direction. It takes many weeks for a top to form and I see no evidence of one beginning to form. This weekly chart of the S&P 500 Index ETF shows the index to be in a strong Weinstein Stage 2 up-trend which began in early 2012. As long as the SPY remains above its rising 30 week average (red line) I stay invested on the long side. To learn more about how I use stage analysis, listen to my December, 2012 Worden TC2000 video, whose link appears to the right of this post.
I am taking a vacation and will return to post on June 7. The market is in a post-earnings release period and probably will not make a major move until sometime in July when 2nd quarter earnings are released. We do often have a shake-out decline just before the earnings period so we may have some weakness in late June. No one knows what will happen, however. If we get a major move, I will try to post during this period. It would take a lot of deterioration, however, to create a GMI sell signal. The market remains in a powerful up-trend, as this weekly chart of the SPY shows. It has successfully broken through its green line top. Major support for the SPY is way back around the green line or at 150 (red line, 30 week average). Have a great two weeks!