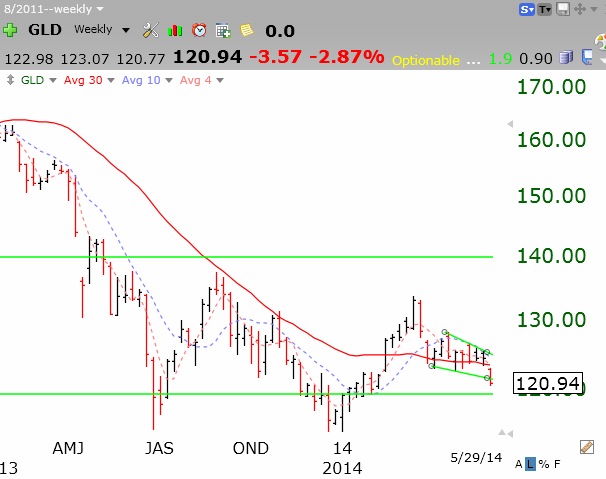
GLD has now closed below its critical 30 week average (red solid line). It could be forming the right shoulder of a head and shoulders bottom formation or be starting a new leg down. Time will tell. Click on chart to enlarge.
Stock Market Technical Indicators & Analysis
GLD has now closed below its critical 30 week average (red solid line). It could be forming the right shoulder of a head and shoulders bottom formation or be starting a new leg down. Time will tell. Click on chart to enlarge.
IBD finally calls market in up-trend, after follow-through day on Tuesday. On the other hand, Tuesday was the 10th day of the current QQQ short term up-trend, as I call them. TQQQ has provided me with some nice gains since then.
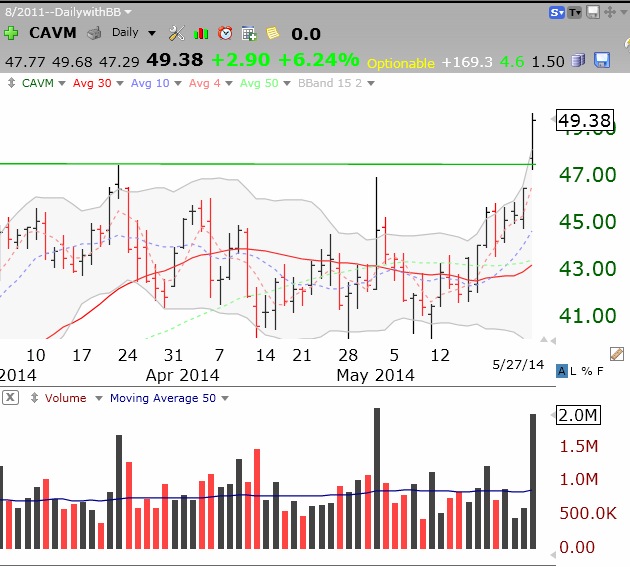
CAVM had a high volume green line break-out to an all-time high. Check out this daily chart.