Things unfolded as I suggested on Sunday night. AAPL is rising again.
All Posts
3rd day of $QQQ short term up-trend; $QCOR strong
Hard as it is to believe, the QQQ is still in a short term up-trend. According to IBD the put/call ratio was 1.02 at Thursday’s close. This is a contrary indicator. When the p/c ratio is greater than one it indicates option players are bearish. When it gets to this extreme the market typically at least has a bounce. A reading of 1.20 represents very extreme bearishness and is often followed by a rally. We will have to see on Friday whether a reading of 1.02 is sufficient to turn this decline.
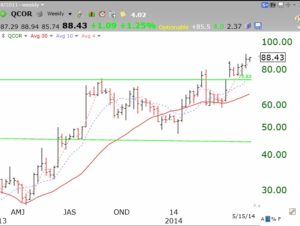
Meanwhile, I noticed strength in QCOR, which had a high volume green line break out to an all-time high about 5 weeks ago. This weekly chart shows that QCOR is holding its own through this market weakness. QCOR climbed 1.25% on Thursday. MNK is buying QCOR and shareholders will receive some payment in MNK shares. With MNK rising, so does QCOR.
2nd day of $QQQ short term up-trend
Welcome to all of those who attended the U of MD. financial planner workshop on Wednesday. You can find the list of the books I mentioned in my speech to the lower right side of this page. For a quick review of my approach, please watch the December, 2012 video, link to the right of this post.
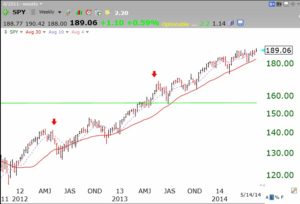
The SPY (S&P 500 ETF) remains in a longer term Stage 2 up-trend. The weekly chart below shows the SPY to be rising nicely above its 30 week average (red line).
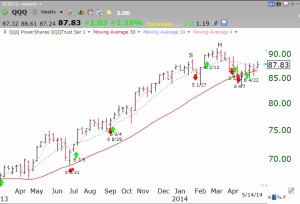
The QQQ (NASDAQ 100 ETF) is also in a Stage 2 up-trend, but is a little weaker than the SPY, as it is hugging the 30 week line. The green and red arrows on this chart represent the GMI buy and sell signals.
 I remain fully invested in mutual funds in my university pension.

