Mutual fund window dressing should raise the leaders next week.
All Posts
25th day of $QQQ short term up-trend; $MTSI: green line break-out
Next week we should see strength in the leaders as we get to the end of second quarter and mutual fund window dressing.
MTSI had a green line break-out to an all time high on Tuesday. Check out this weekly chart. (I bought some.)
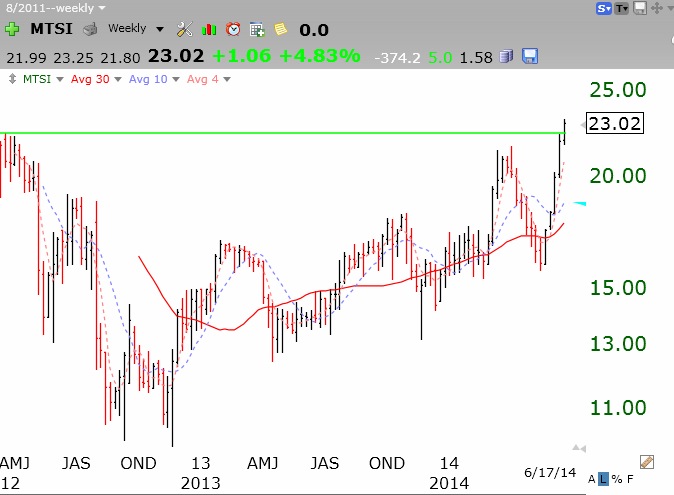 A recent IPO that forms a multi-month base and then breaks to an all time high can be a winner. If it falls back below the green line, I exit.