All Posts
13th day of $QQQ short term up-trend; $PTLA , $IMAX and $SYNA shine.
Many of you wrote me to ask whether you can receive my TC2000 alert emails. I send them only to students in my university class on technical analysis. I have trained my students to understand my approach and how to interpret my signals. One day I might offer my course and the alerts to a wider audience.
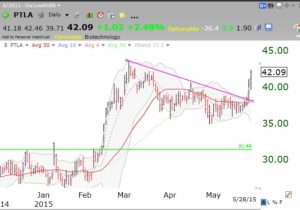
PTLA is a biotech that my stock buddy, Judy, first told me about. It has had a green line break-out, a subsequent consolidation, and is now rising again. I own it.
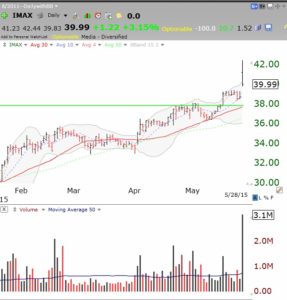
 Remember I wrote about IMAX when it had a green line break-out. Look at Thursday’s action!
 Note the many high volume up-days (black volume spikes) since April leading into the green line break-out. Traders with deep pockets were buying before the big announcement. By reading the chart signals one could ride along with them.
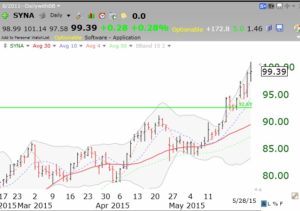
SYNA is another recent successful green line break-out.
 I sell any green line break-out that declines back below its green line, and buy it back if it comes back above it. To see a webinar I did on green line break-outs, go to the link on the right for my December 2012 webinar.
12th day of $QQQ short term up-trend; $PTLA breaks out
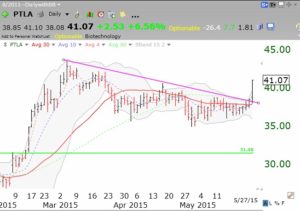
What an incredible day! The types of stocks I trade are booming. Check out FOMX, AMBA, NXPI, PTLA, BLUE, REGN, AHS, to name a few. Those of you who receive my TC2000 email alerts would have received one on PTLA on Tuesday, before its advance on Wednesday. Judy has been talking to me about PTLA for months.
