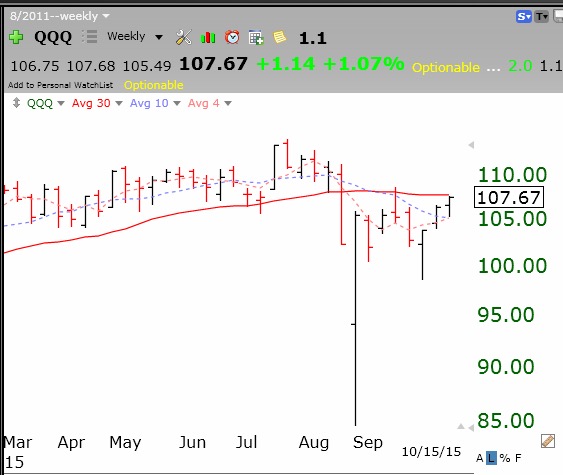
QQQ up against 30 week average (red line).
Stock Market Technical Indicators & Analysis
QQQ up against 30 week average (red line).
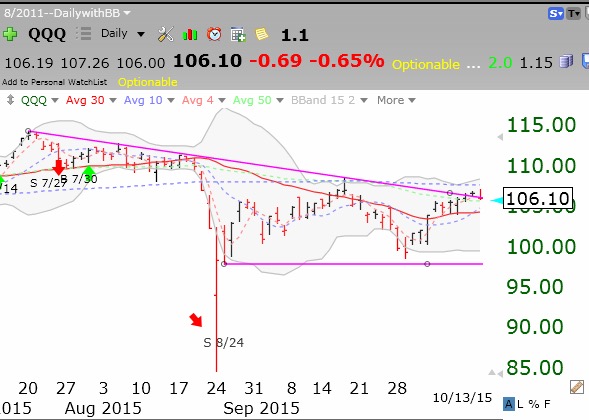
QQQ could not break through resistance. It is very rare for the GMI signals to change so quickly.
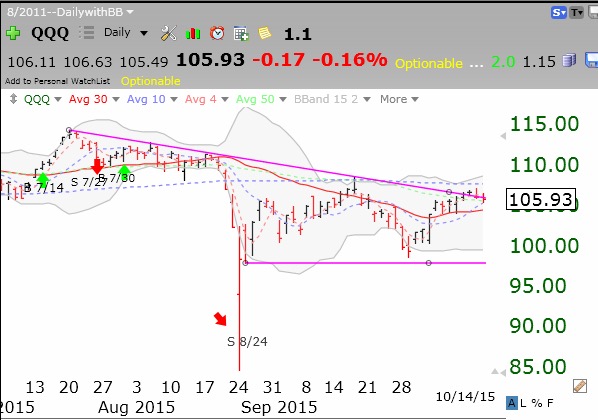
The GMI fell back to 2 and could go back to a Sell signal with a weak day on Wednesday. Meanwhile my indicators show a very over-bought market with a daily 10.4 stochastic of 94. Almost 70% of the Nasdaq 100 stocks have over-bought stochastics. I remain on the sidelines in cash.