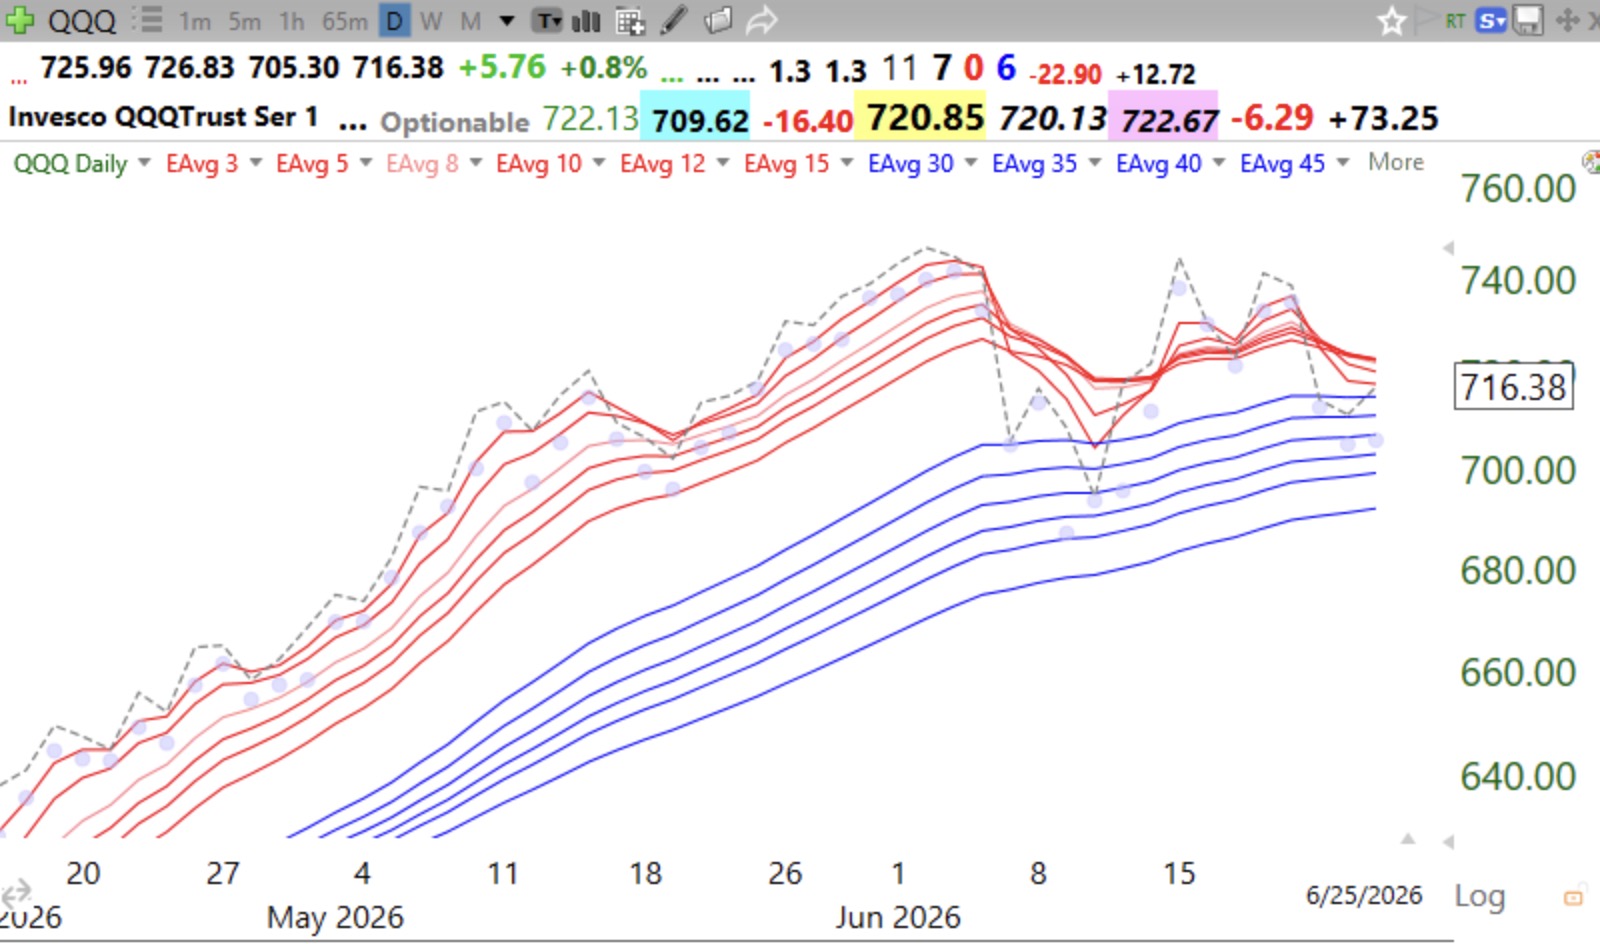
Blog Post: Day 64 of $QQQ short term up-trend; Since QQQ had a blue dot on June 23, QQQ has not closed below its 8 EMA or 4wk SMA, see my TraderLion talk from Sunday for an explanation.

GMI6/6
GMI-27/9
T210859%

The blue dot also occurred with a bounce up off of the 21 EMA and the lower 15.2 Bollinger Band. I suspect that when QQQ does finally close below its daily 8 EMA it will signal some short term weakness in the up-trend. Note the possible tradable buys when QQQ bounced up off of its 8 EMA. My TC2000 scan finds such occurrences. When Richard Moglen and I create our online Mastercourse, these setups will be built into Deepvue. Stay tuned here to receive course announcements….

Screenshot

As I said in my TraderLion presentation, an equity tracking the daily 8 EMA often tracks the 4 wk moving average, see weekly chart. Red dotted line is 4 wk avg.

Screenshot

Blog Post: Day 61 of $QQQ short term up-trend; 64 out of 6,410 US stocks traded at an ATH on Wednesday; one of them, $CLS came back after bouncing off of its 21 EMA, see its promising daily and weekly charts.

GMI6/6
GMI-25/9
T210868%

CLS had been tracking its 8 EMA beautifully and when it closed below it on Tuesday, I thought that it had broken trend. However, it retook its 8 EMA on Wednesday after finding support at the 21 EMA. If a setup fails and then succeeds, it can be a good trade to buy the stock back. Note how long CLS is also tracking its 4 wk average (red dotted line). That is another strategy to consider for identifying promising stocks. CLS reports earnings on 7/28.

Screenshot
Screenshot