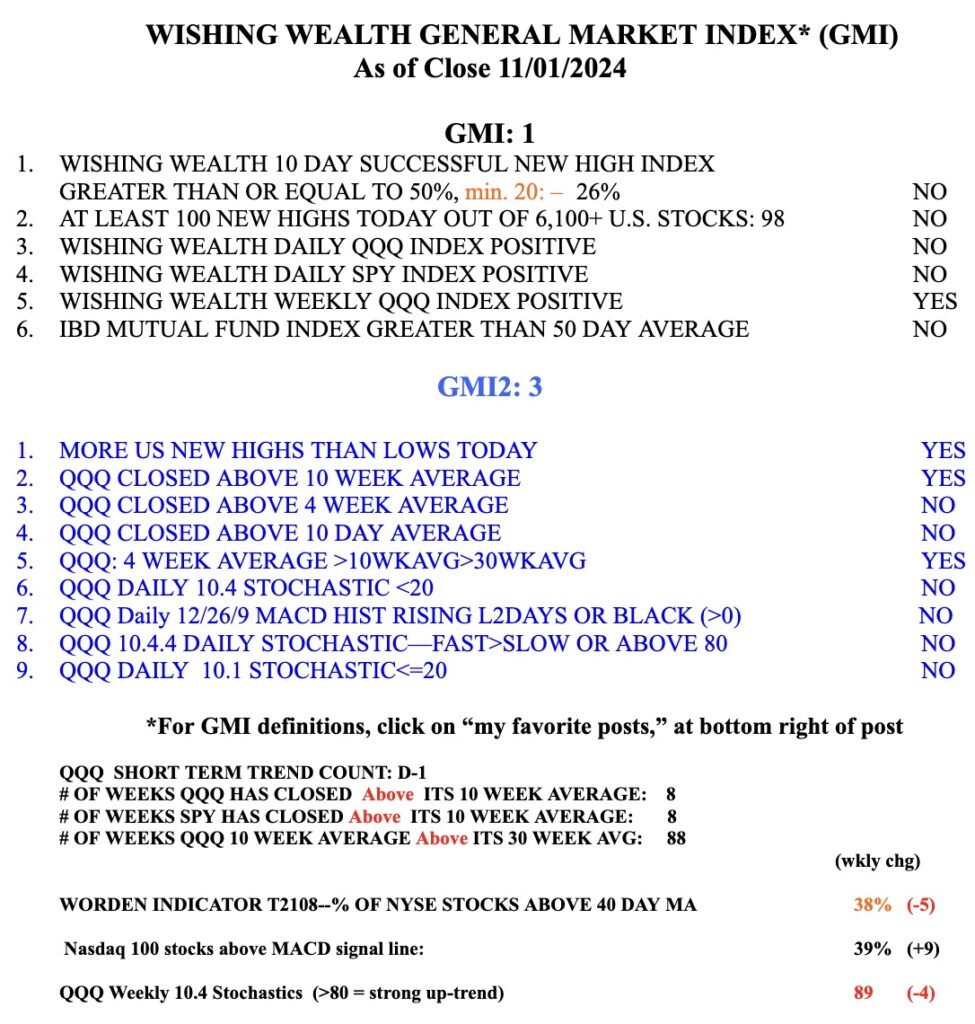
Blog Post: Day 2 of $QQQ short term down-trend; 23 US new highs and 157 lows, most since May 2nd; long treasury bonds in steep decline as interest rates climb, see $TLT; why interest rates move inversely to bonds prices explained

GMI1/6
GMI-21/9
T210822%

The Wall Street saying is that interest rates move inversely to bond prices. This is like when a stock price declines the dividend yield rises. For example, a stock that pays $4 per year would have a yield =4%%,  if the stock’s price were $100 (4/100=4%). If the dividend remains the same and the stock price falls to $50, the yield would climb to 8% (4/50=8%).  So it is with bonds which typically have a fixed interest rate/dividend. Falling bond prices = higher interest rates. TLT gapped down on Thursday.

Blog Post: Day 1 of new $QQQ short term down-trend; IBD calls Market in Correction; 63 US new highs and 63 lows; cash is king, hiding in $TBIL, see its bizarre daily chart

GMI1/6
GMI-23/9
T210830%

I am concerned that the put/call ratio is only .91. There is not enough fear in this market to turn it around. The chart of QQQ is looking ominous. Short term support has not held. I am mainly in cash with some $TBIL in my trading account.

TBIL is an ETF that invests in short term treasuries. It pays a dividend monthly, which explains this unique daily chart. (TBIL is reduced by each dividend payment.) I enjoy seeing the dividend payment credited to my account each month. Its yield is a little over 5%. Check it out.


Blog Post: Day 14 of $QQQ short term up-trend, could end Wednesday; 52 new US highs and 69 lows, 14 at ATH; on Fed watch Wednesday; $ERIE at ATH after a GLB, see daily chart and the weekly flag pattern

GMI2/6
GMI-21/9
T210832%

ERIE reached an ATH on Tuesday. It has a very nice technical pattern, having gapped higher in early August and then consolidating sideways for 5 weeks. In early August, ERIE was added to the S&P MidCap 400. If the market holds on Tuesday, ERIE could rocket higher. It must not close back below its green line (286.49). Note the Bollinger bands are expanding after having constricted. ERIE came up on my scan for stocks at an all-time high, ATH. Keep in mind that few stocks are hitting yearly highs and there are very few at ATHs. ERIE has a MarketSmith Comp rating=99 and RS=93. Insurance companies are likely raising rates, and profits,  after  the recent climate related debacles.

Weekly chart shows a promising flag pattern.