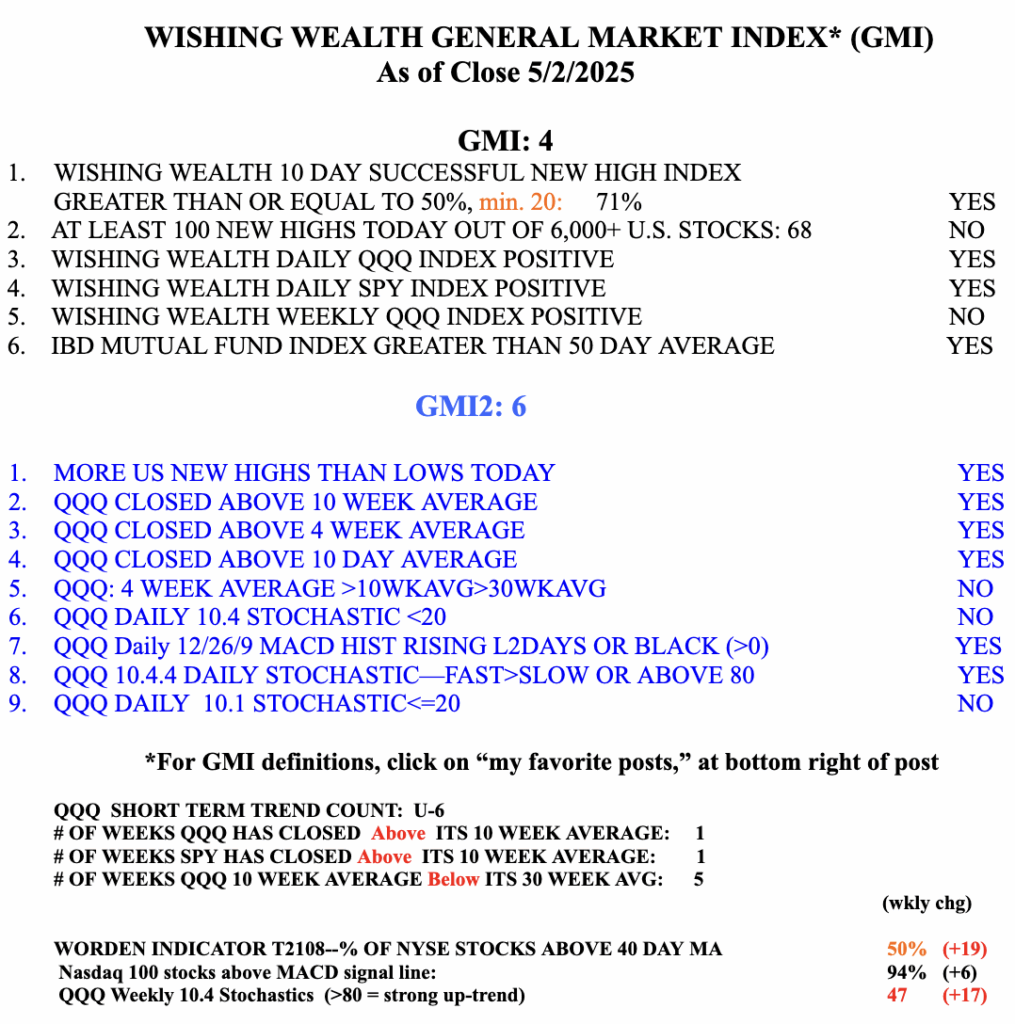
The GMI =4 and now meets my criteria for a change to Green. However, I will be much more confident of this change when the GMI=5 or 6, indicating there are sufficient numbers of stocks at new highs. However, it is time to look at the list of stocks that traded at an ATH on Monday. Lists of stocks reaching an ATH often contain huge leaders. It is worth researching their fundamentals and stories. For example, in 2008, after the horrendous market decline, GMCR, the makers of the Keurig coffee machines, rose quickly to an ATH and turned out to become a 13 bagger. The list below is sorted by each stock’s close Friday/close 250 days ago, shown in the last column. All of these stocks are up at least 50% from last year, a good sign of a potential leader. Thus, RGC is 17.4 times its close a year ago. Note also the industries represented and any multiple stocks in the same industry. Education & training, and insurance appear twice, a sign of group strength. Now look for any GLBs and have fun studying them for a low risk setup. Also beware of projected earnings dates, listed in the table.