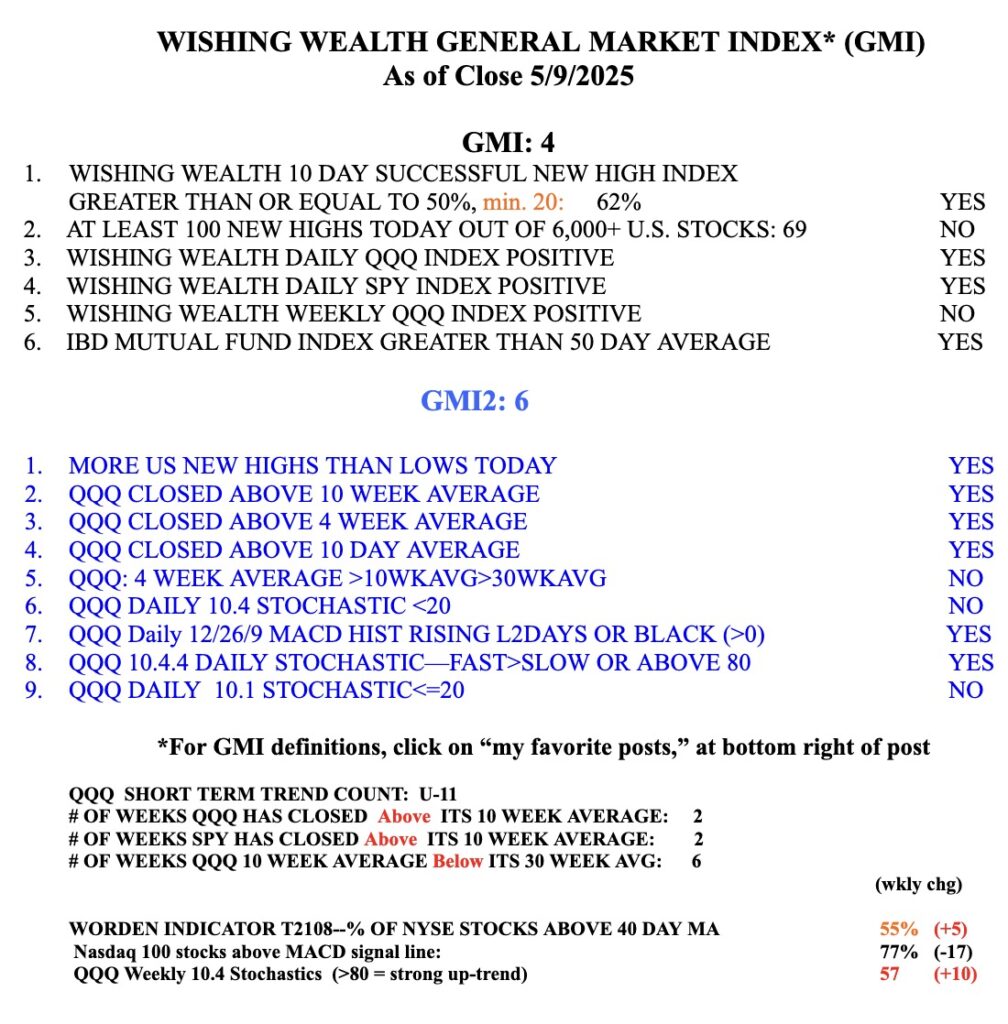
A stong advance is evident when the 4wk>10wk>30 average and the stock continually climbs above the 4 wk average. It is clear from this chart that QQQ is now below the 4 wk average (red dotted line). If it closes the week below, it suggests to me that the recent up-trend is over for now. We now have to see whether it finds support at the 10 wk avg (blue dotted line). SPY and DIA show similar patterns. The longer term trend remains up as long as the index is rising above the climbing 30 wk avg (Stage 2). I am mainly in cash now in my trading IRA.
All Posts
Blog Post: Day 40 of $QQQ short term up-trend; 73 US new highs and 3 lows; Magnificent 7 all decline, see table; $AAPL has double top at green line peak? See weekly chart.
These big name tech stocks fell. However, many stocks were extended and by my definition, the number of NASDAQ 100 stocks that were extended fell from 42 on 12/29 to 5 on Tuesday. The range last week was 42-54% extended stocks.
AAPL is looking quite weak. This weekly chart shows a possible double top. Note AAPL found resistance at its green line ATH.
Blog Post: Day 38 of $QQQ short term up-trend; $CHAT, after a GLB, closed at ATH and is an ETF focusing on AI, see daily and monthly charts and list of holdings
Here is a list of CHAT’s holdings. Note the recent GLB, green line break-out, to an all-time high, ATH. CHAT came public in May of this year.