This weekly chart shows that SHOP has had a GLB (green line break-out to an all-time high).
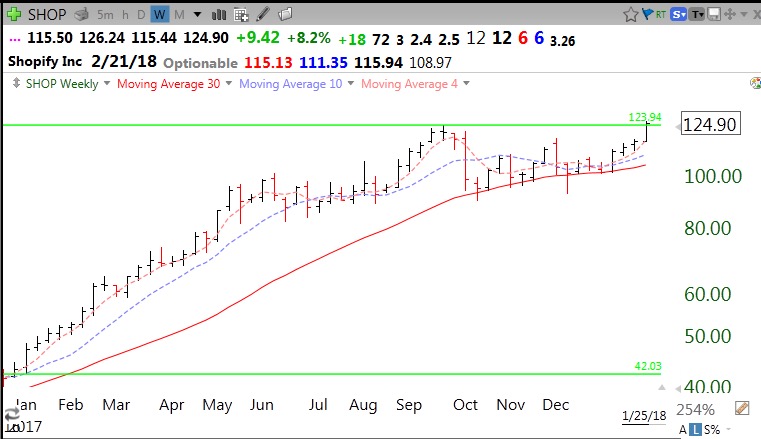
It has a beautiful daily RWB up-trend. Note Thursday’s above average volume rise through the green line.
Stock Market Technical Indicators & Analysis
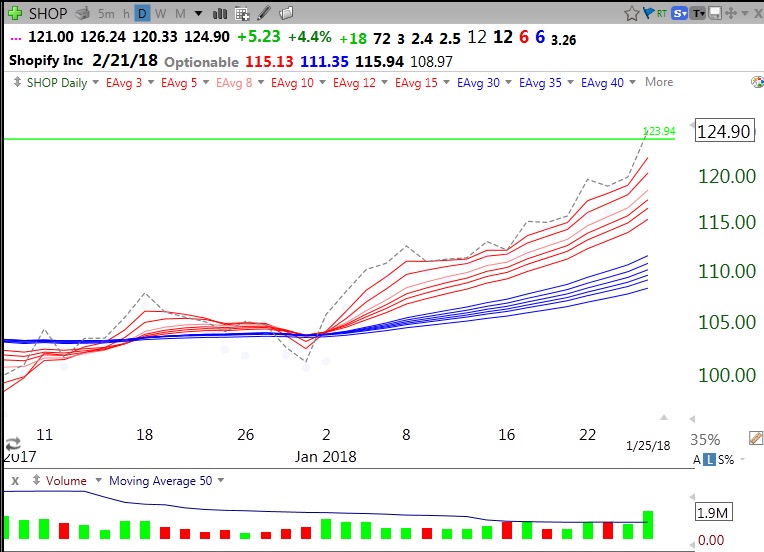
This weekly chart shows that SHOP has had a GLB (green line break-out to an all-time high).
It has a beautiful daily RWB up-trend. Note Thursday’s above average volume rise through the green line.
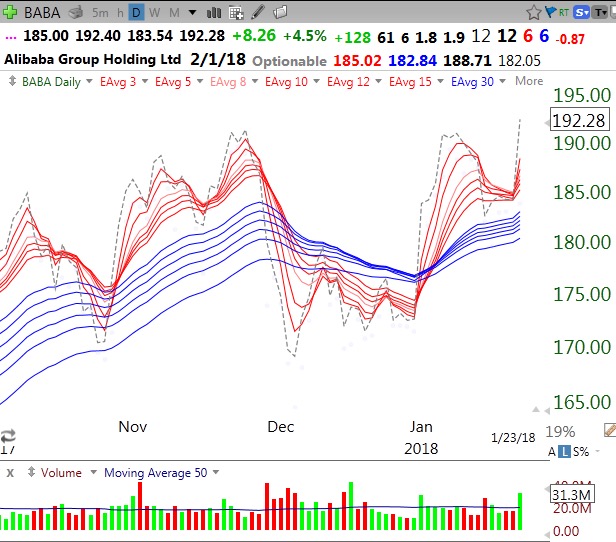
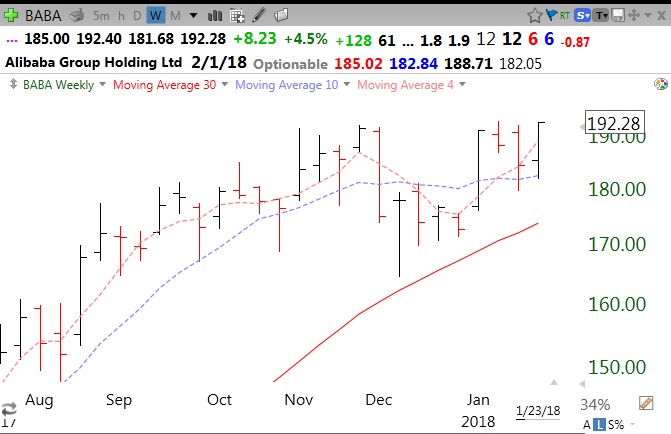
This weekly chart suggests a possible cup with handle pattern. Looking for a high volume break-out on Wednesday.
Below is daily RWB chart. Note Tuesday’s high volume rise.