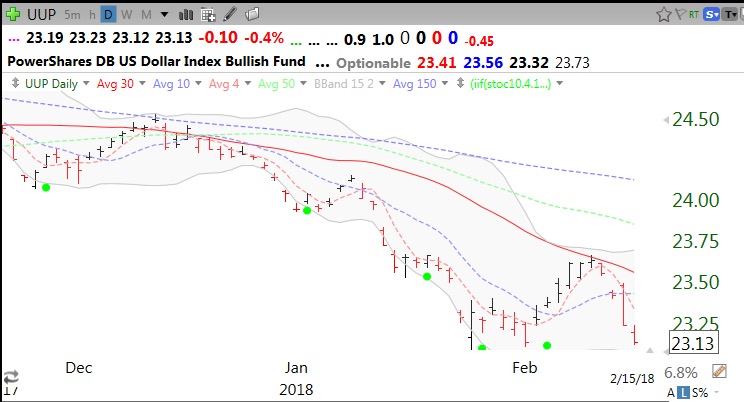
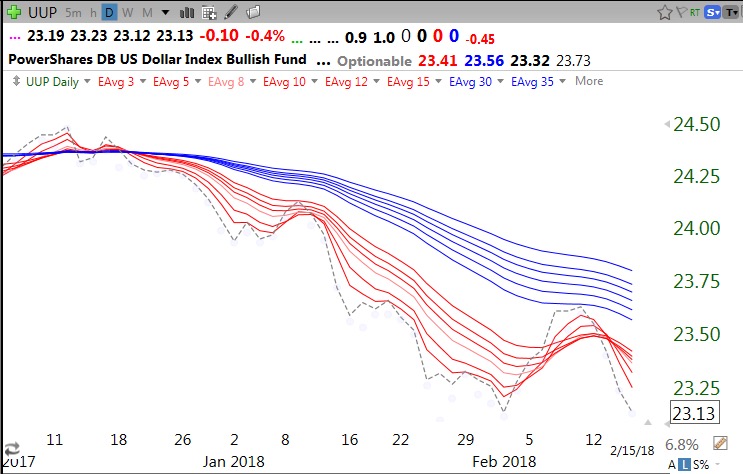
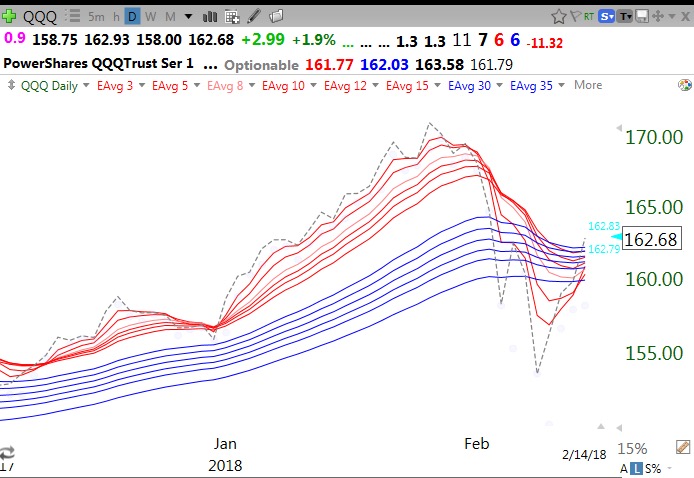
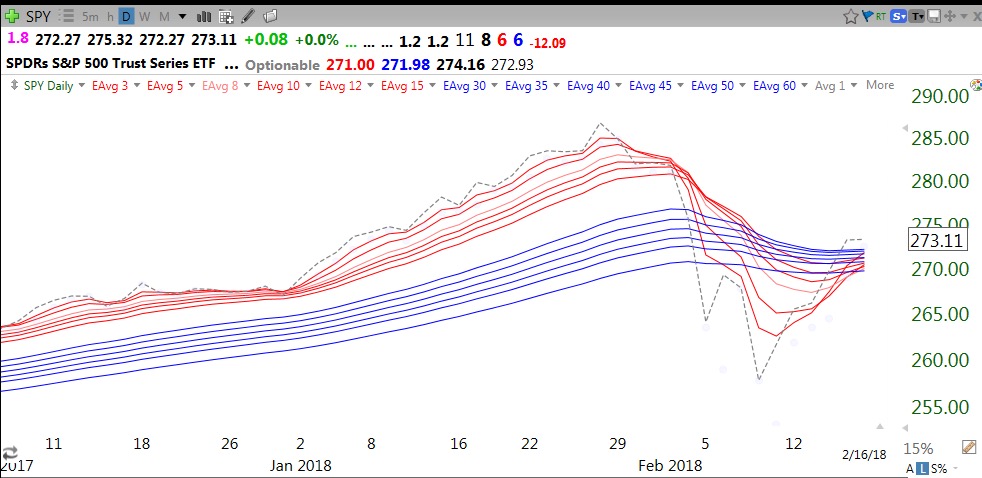
On Friday my QQQ short term trend indicator turned up. A good day on Tuesday will also turn the GMI back to Green. Remember, trend followers follow the trend and do not anticipate a turn. The GMI typically turns Green several days after a bottom is in. As I wrote, however, the put/call ratio and T2108 had extremely bearish readings that did signal the bottom on the day it was reached. Whether this short term bottom holds and the market regains all-time highs is yet to be seen. If the market should stall out before reaching new highs, the next decline could be swift. The current daily RWB chart of the SPY still looks weak. If it declines then we have to see if the recent bottom holds….
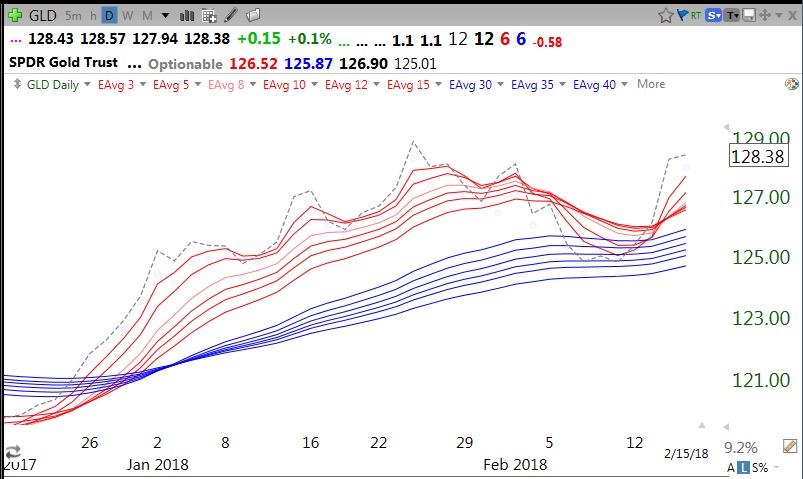
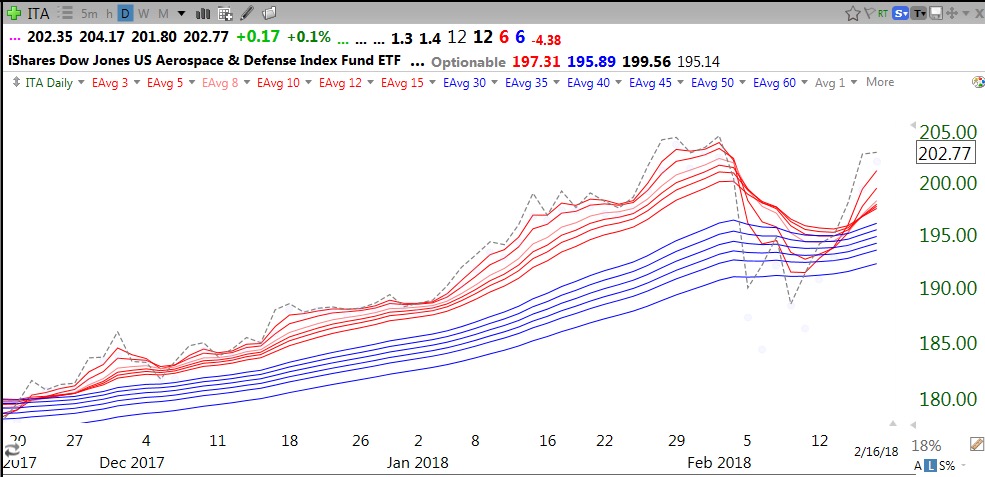
I sorted all ETFs by the number of dollars up since 30 days ago. The top two (VXX and VIXY) were the ETFs reacting to the fierce reversal in the VIX. However, the third one caught my attention. ITA, an aerospace and defense ETF, was up $12.74 over the past 30 days. ITA holds a lot of investments in BA, NOC, LMT and RTN. These are companies I would have thought would benefit from the huge recently passed increase in US defense spending. This daily RWB chart shows ITA to be resuming a nice RWB up-trend.
And the monthly chart shows it to be above its last green line and near an all-time high.
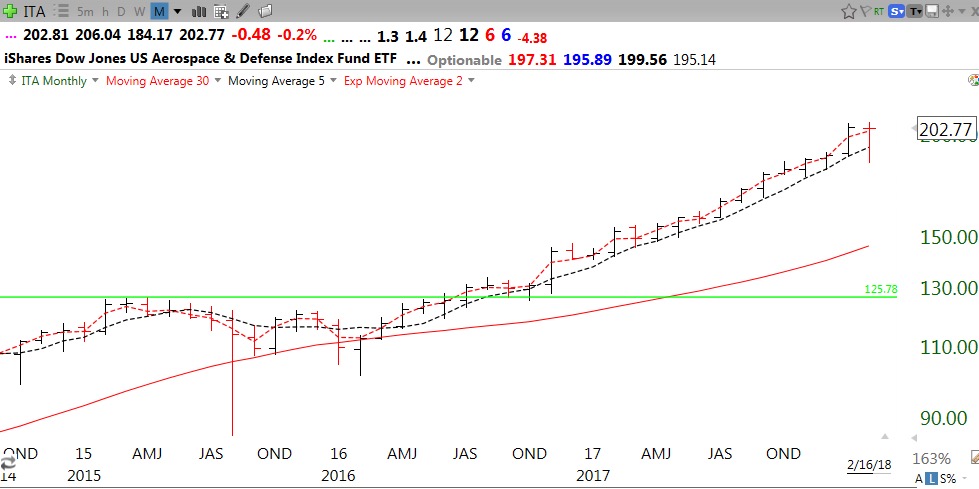
ITA may be just the ETF to own if one wants to own a defensive (pun intended) portfolio….
The GMI is at 4 (of 6) and two consecutive days above 3, will change its general market signal from Red to Green. Both the QQQ and SPY have closed back above their 10 week averages.