Three day weekend coming. Markets closed on Monday, good time to take stock of one’s account 🙂
All Posts
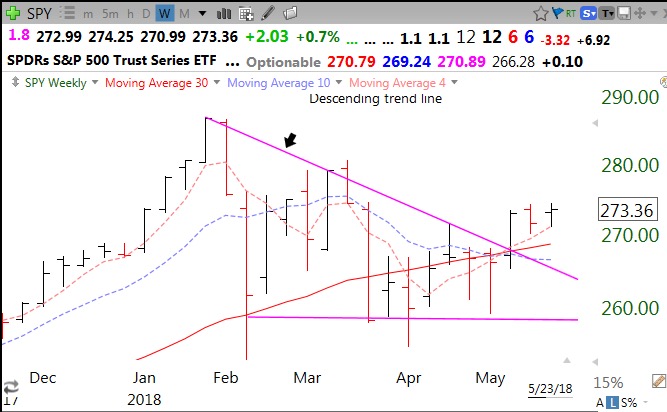
$SPY holding break-out; 16th day of $QQQ short term up-trend
This weekly chart shows that the SPY is holding the break-out from the descending trend line.