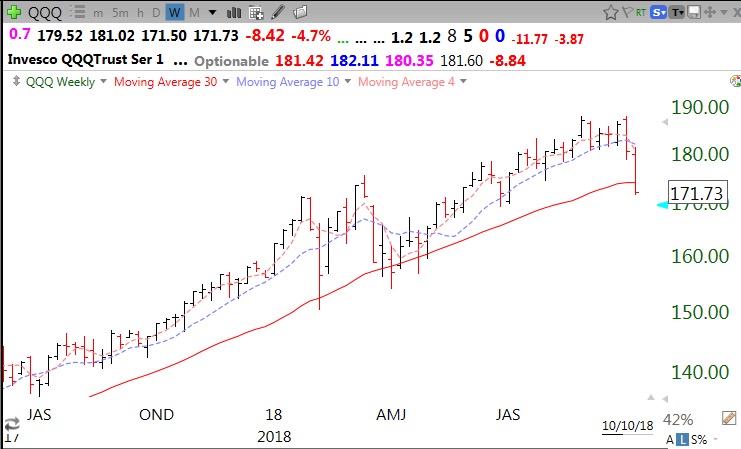
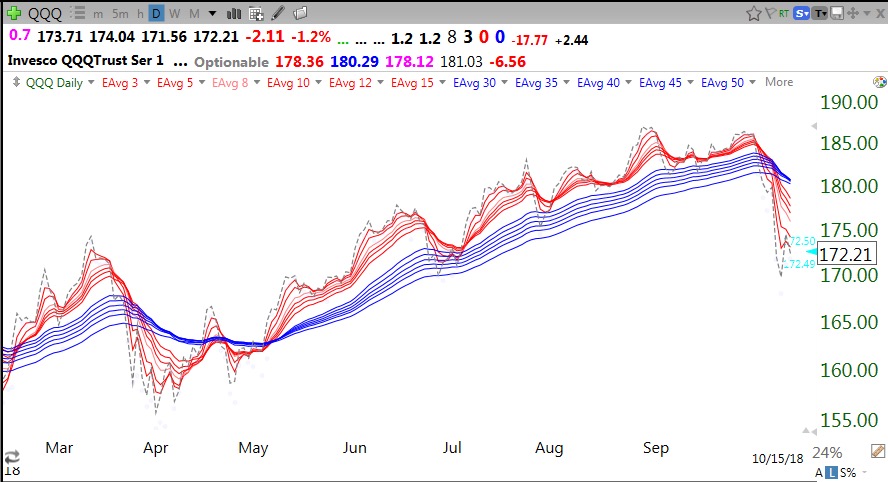
QQQ is in a daily BWR down-trend like last April.
Stock Market Technical Indicators & Analysis
QQQ is in a daily BWR down-trend like last April.
There has been so much technical damage done that I think it best to remain on the sidelines for now. Thursday was the 5th day of the new QQQ short term down-trend. There will likely be huge volatility for a while as the market retests Thursday’s lows. There were 479 new lows and 9 new highs on Thursday. However, the T2108 reached severely oversold levels, as shown in this weekly chart. I remain in cash.
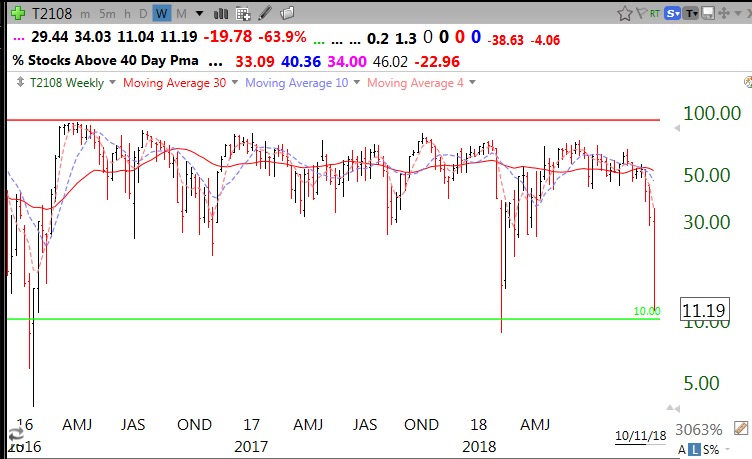
With the put/call ratio=1.16 and T2108 at 17, this is not the time for me to initiate shorts. That would have been appropriate on Monday when the GMI flashed a Red signal or last Friday when the QQQ short term trend turned down after 63 days of a short term up-trend. Better to be in cash until a bottom is formed. However, if T2108 goes into single digits, I will buy some SPY. That is typically bottom territory. The QQQ has now closed below its critical 30 week average (red line in weekly chart below). The 30 week average would have to curve down for me to think a significant bear market (Stage IV decline) is imminent. IBD now says that the market is in a correction. Both the SPY and DIA have now had failed green line break-outs. Stay tuned….