One of the biggest problems I have faced is that I own a growth stock in a nice up-trend and get shaken out, only to see the stock continue rising. I believe that William O’Neil focused on weekly charts because daily charts contain so much noise. This is why I ask my students to have the rule of looking at the stock’s weekly chart before every sale of a long position. If the stocks is still holding its rising 10 week average I suggest not selling. Most of the time one gets shaken out of a good stock it is because there is a sudden drop below an indicator on the daily chart.
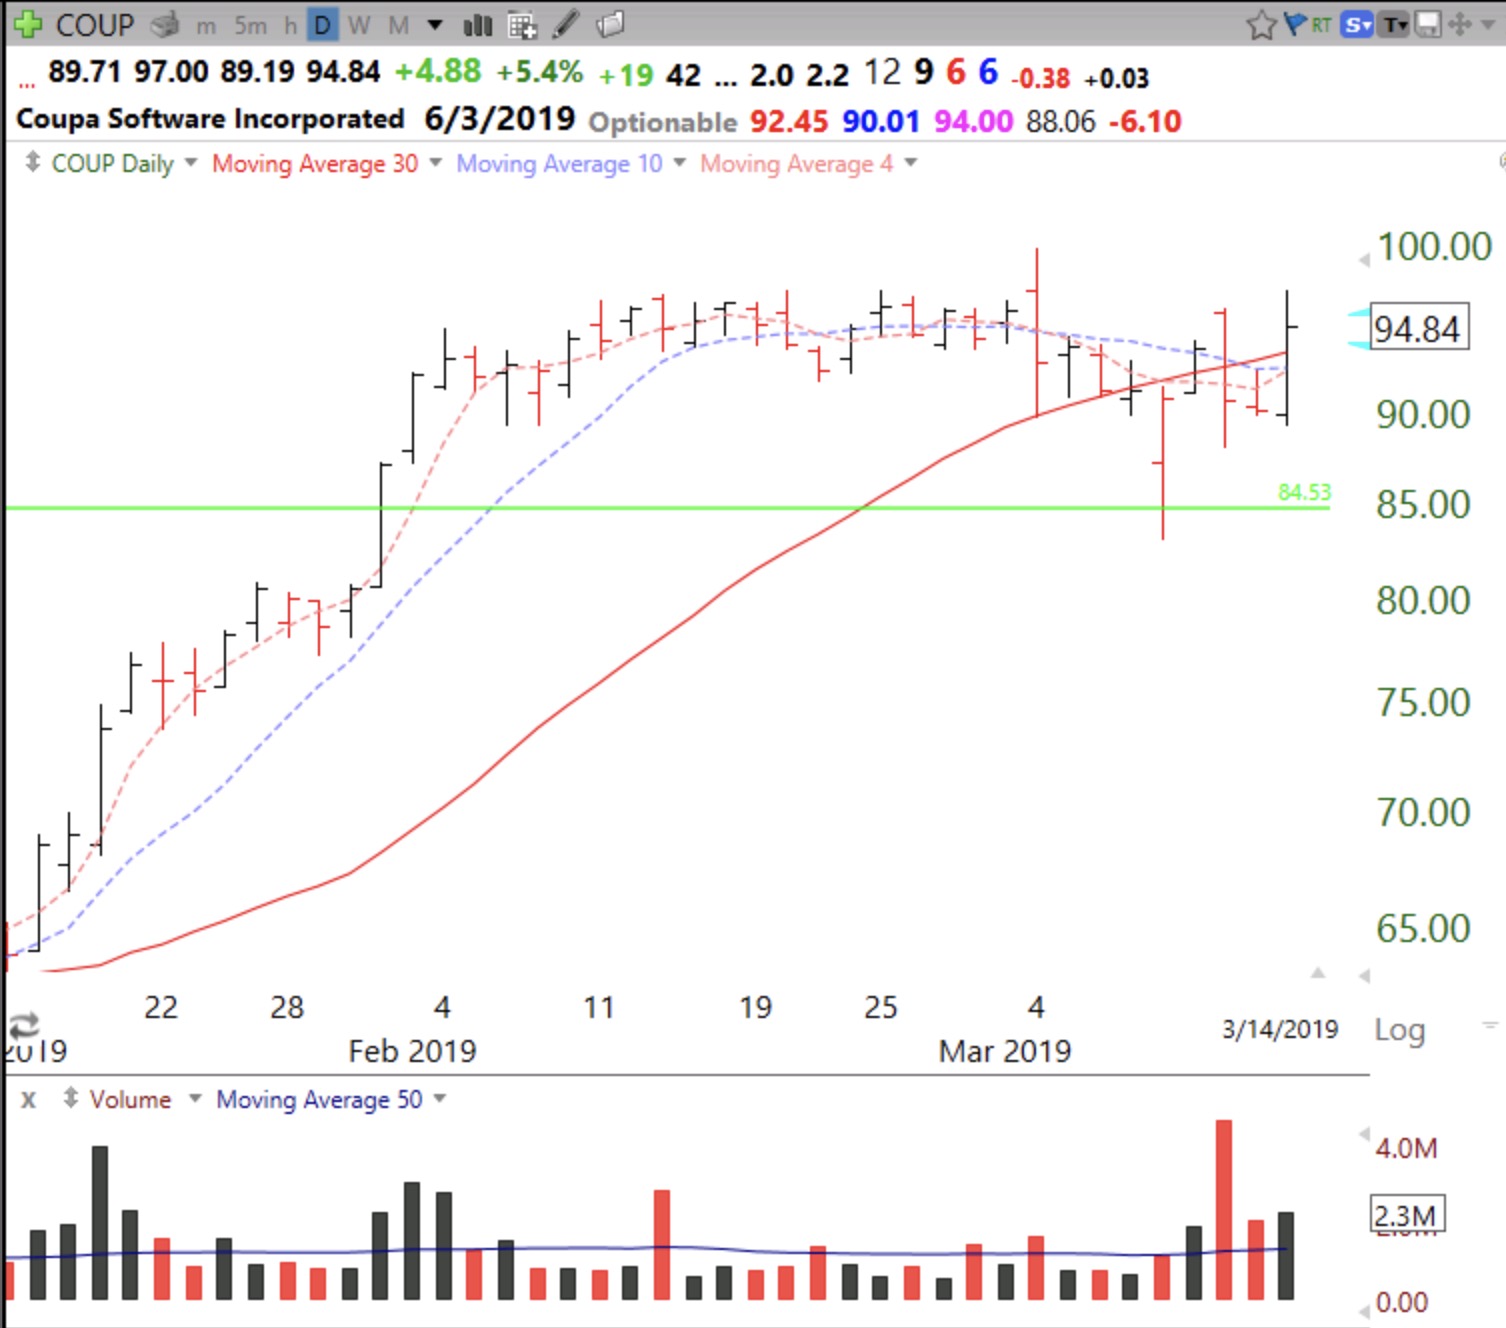
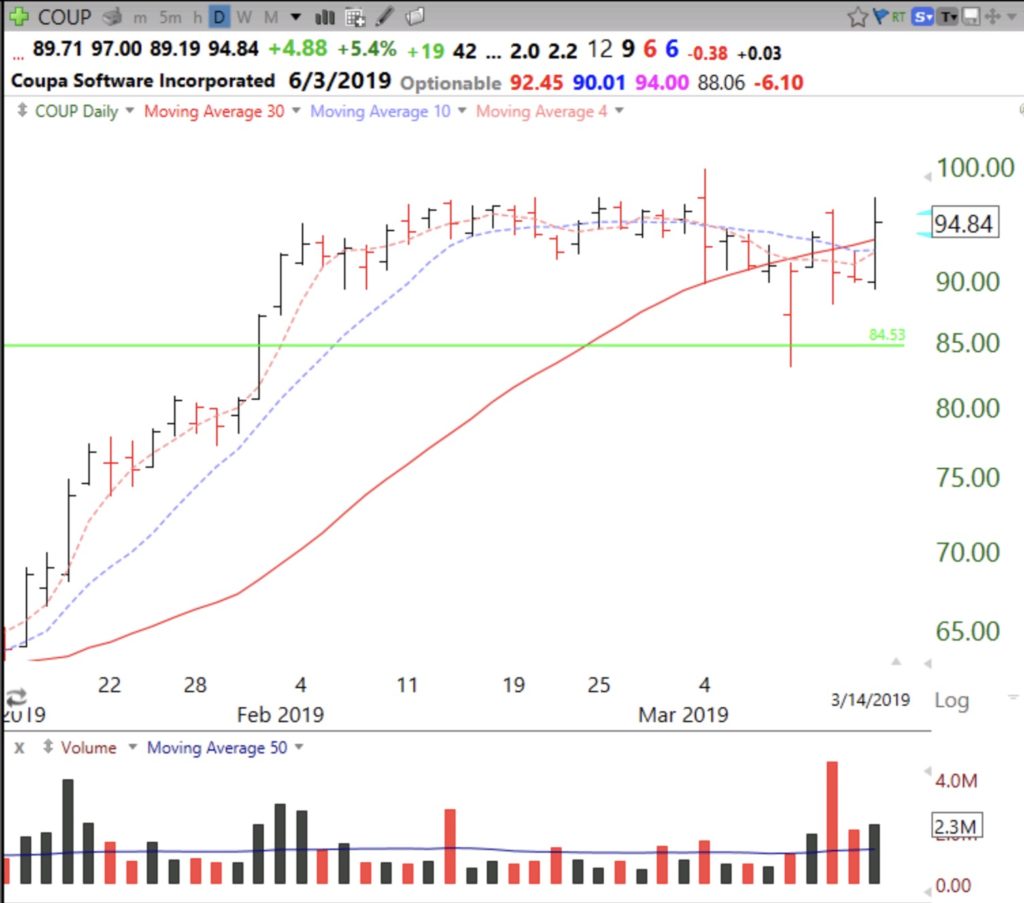
COUP provides an excellent example of this strategy. I bought COUP after its GLB (green line break-out) to an all-time high (ATH). COUP then went sideways for a few weeks and then had a sudden decline below the green line last Friday but closed above its green line. I also often teach my students to sell a GLB stock if it closes below its green line. COUP also declined on above average volume two days later. Both of these events tempted me to sell the stock. But I retained my position. Here is the daily chart.
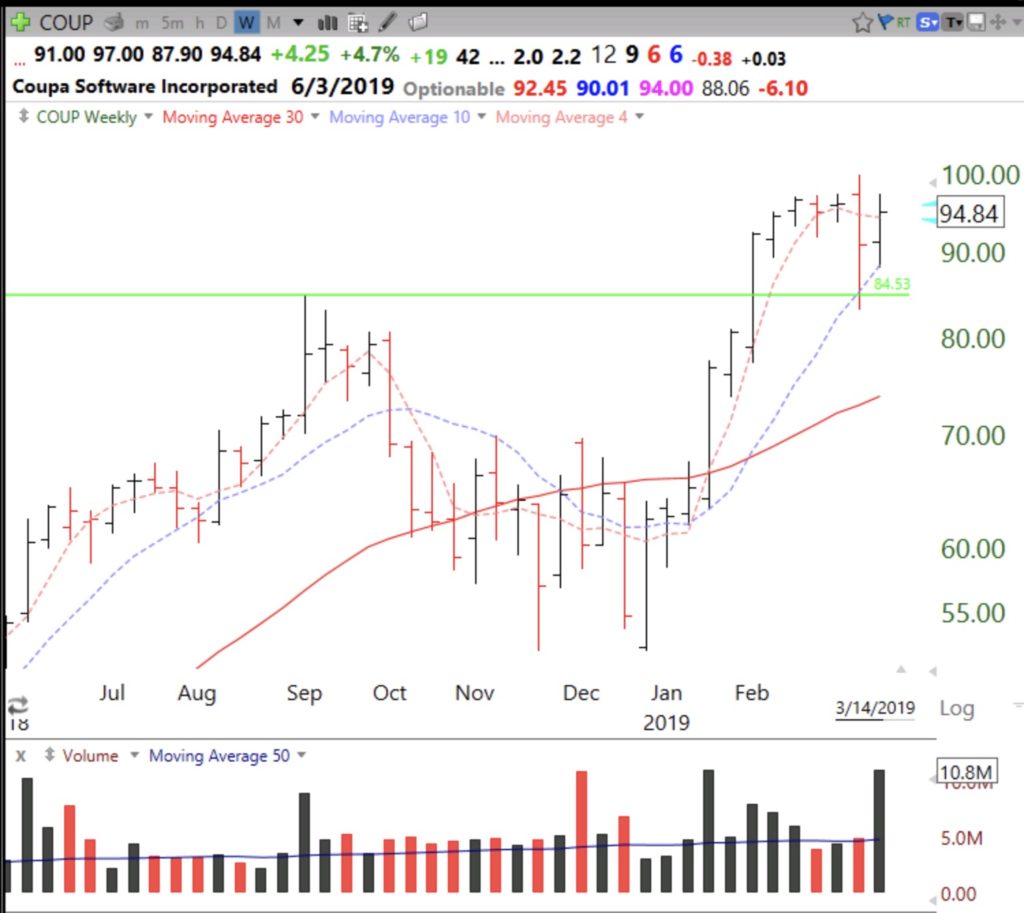
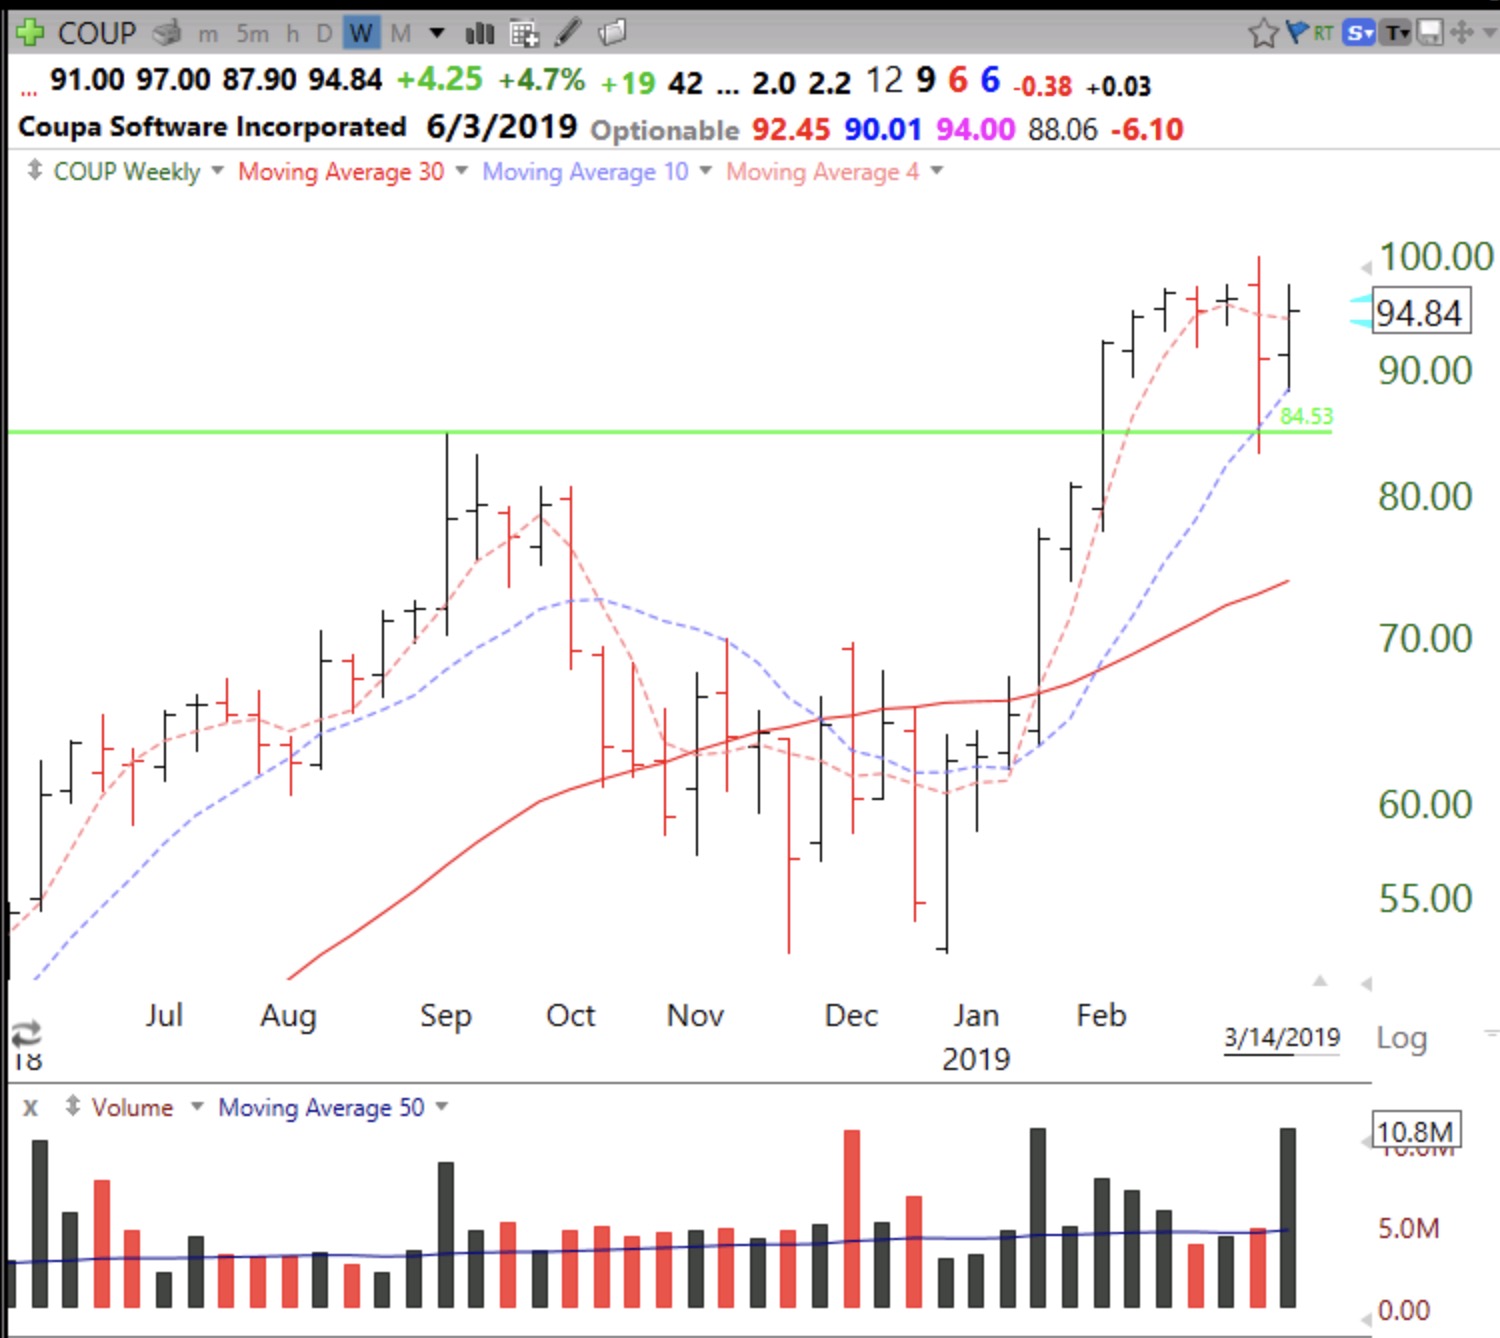
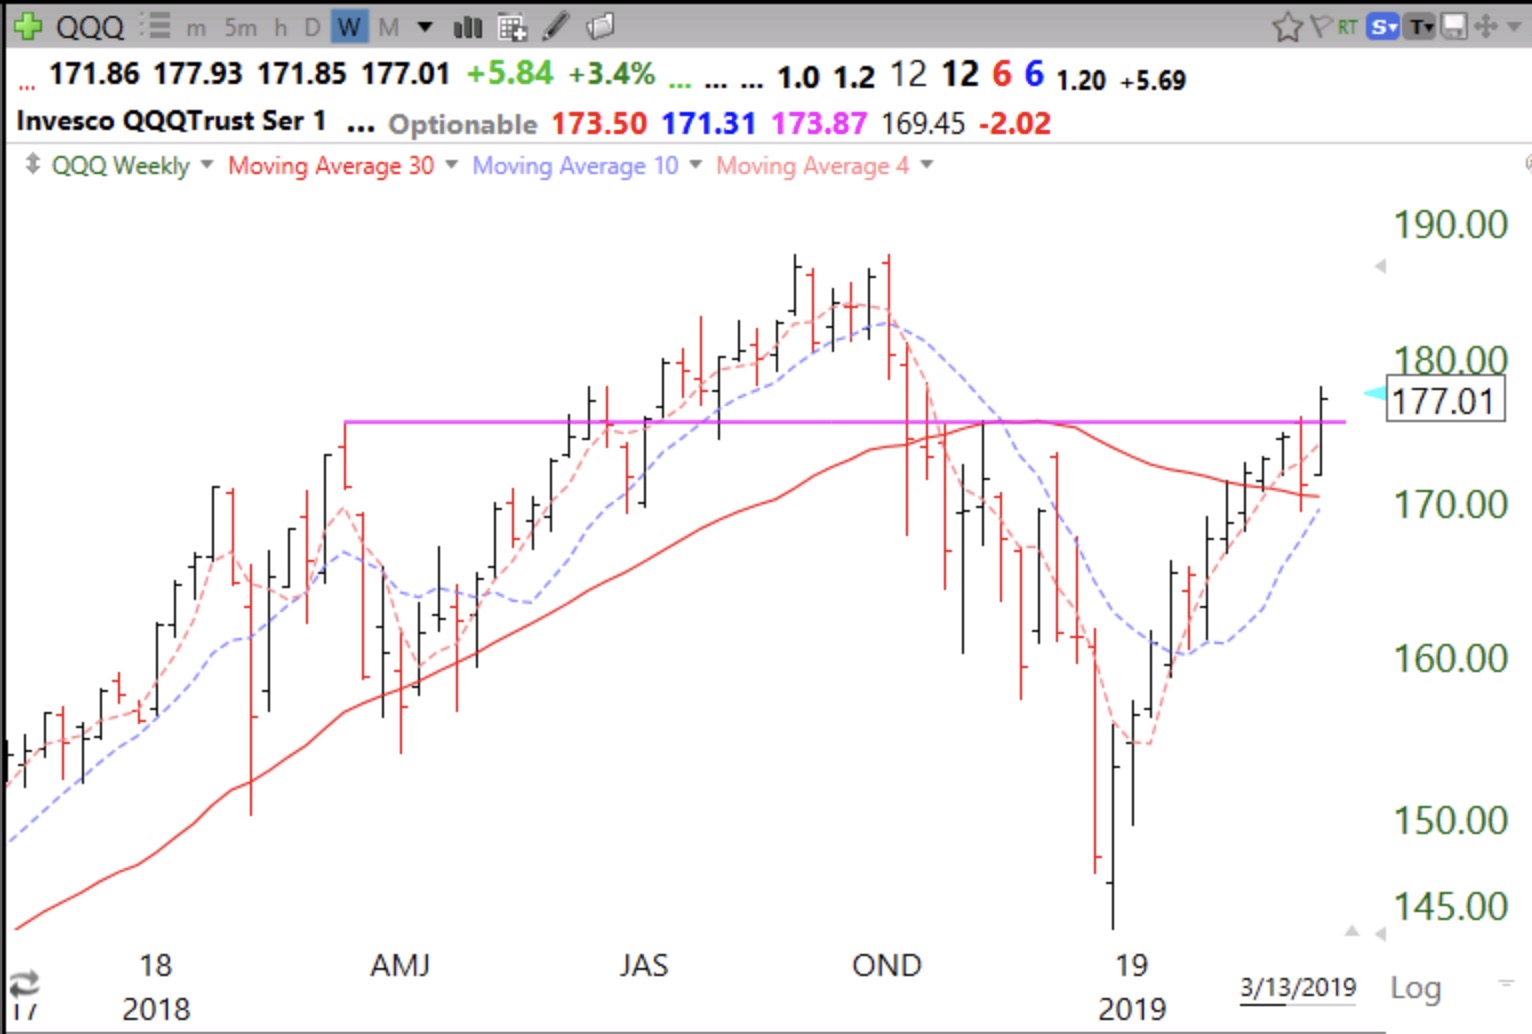
When I looked at the weekly chart I saw no cause for selling. COUP has actually bounced up off of its rising 10 week average (blue dotted line), a strong technical sign of support. A stock’s failure to hold its 10 week average would be a reason for me to sell. In fact, the above average volume this week shows up as an up (black) bar! The moral of the story is that while I may time the purchase of a stock based on its set-up of daily indicators, I should only sell it after viewing its weekly chart.