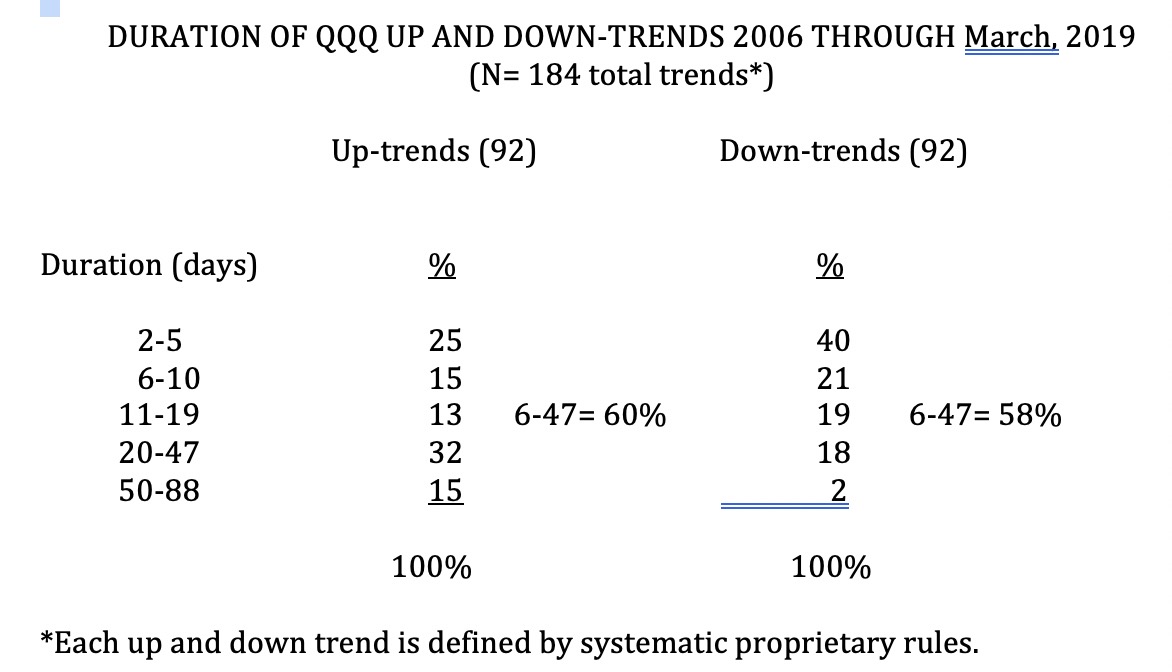
I bought back covered calls and sold all of my positions in SPY and TQQQ last week when the ETFs closed below all of their red lines. Took a small position in SQQQ with the start of the new QQQ short term down-trend. However, my analysis below shows that about 40% of new QQQ short term down-trends last 5 days or less and 58% last 6-47 days. I therefore remain very vigilant and flexible.
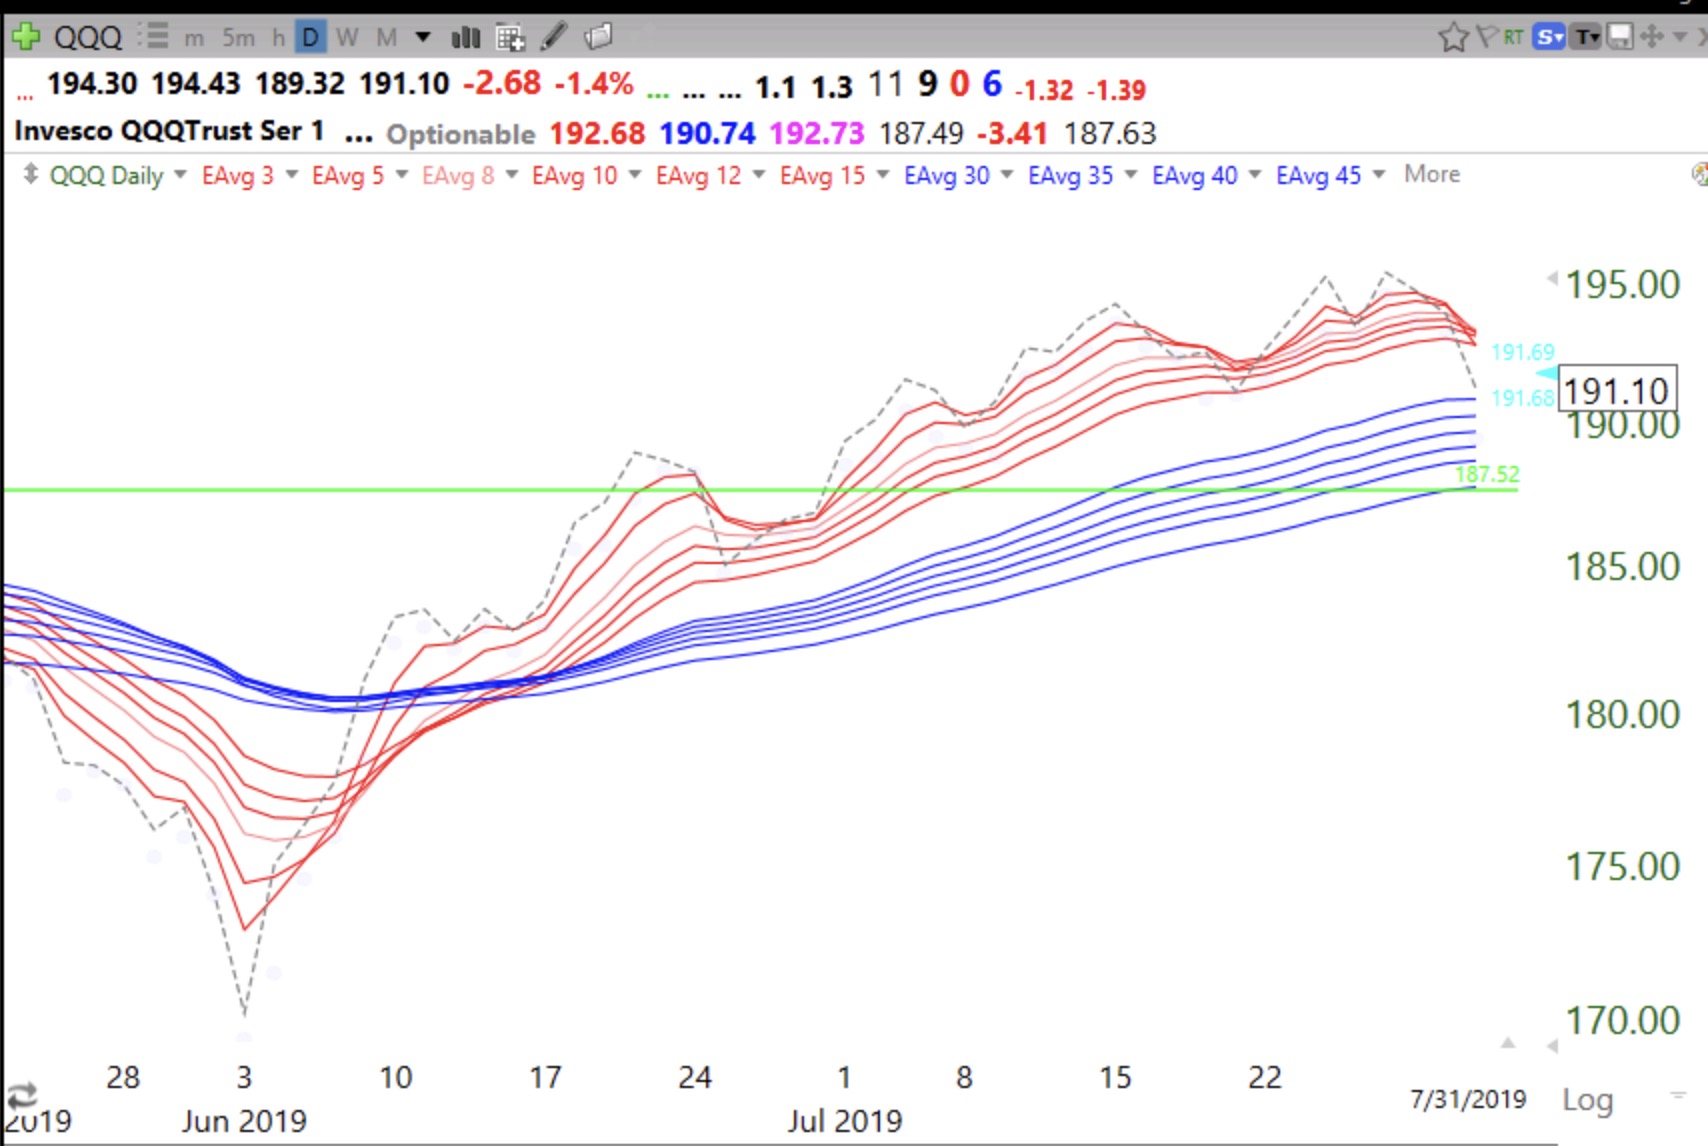
The daily RWB up-trends of the QQQ, SPY and DIA have all ended. They have each closed below all of their red and blue averages, as shown in this chart of QQQ. The dotted line represents the daily close. I will go long again in the market ETFs again when the dotted line closes above all of the red and blue lines and the red lines close back above the blue, leaving a white space between them (RWB pattern).
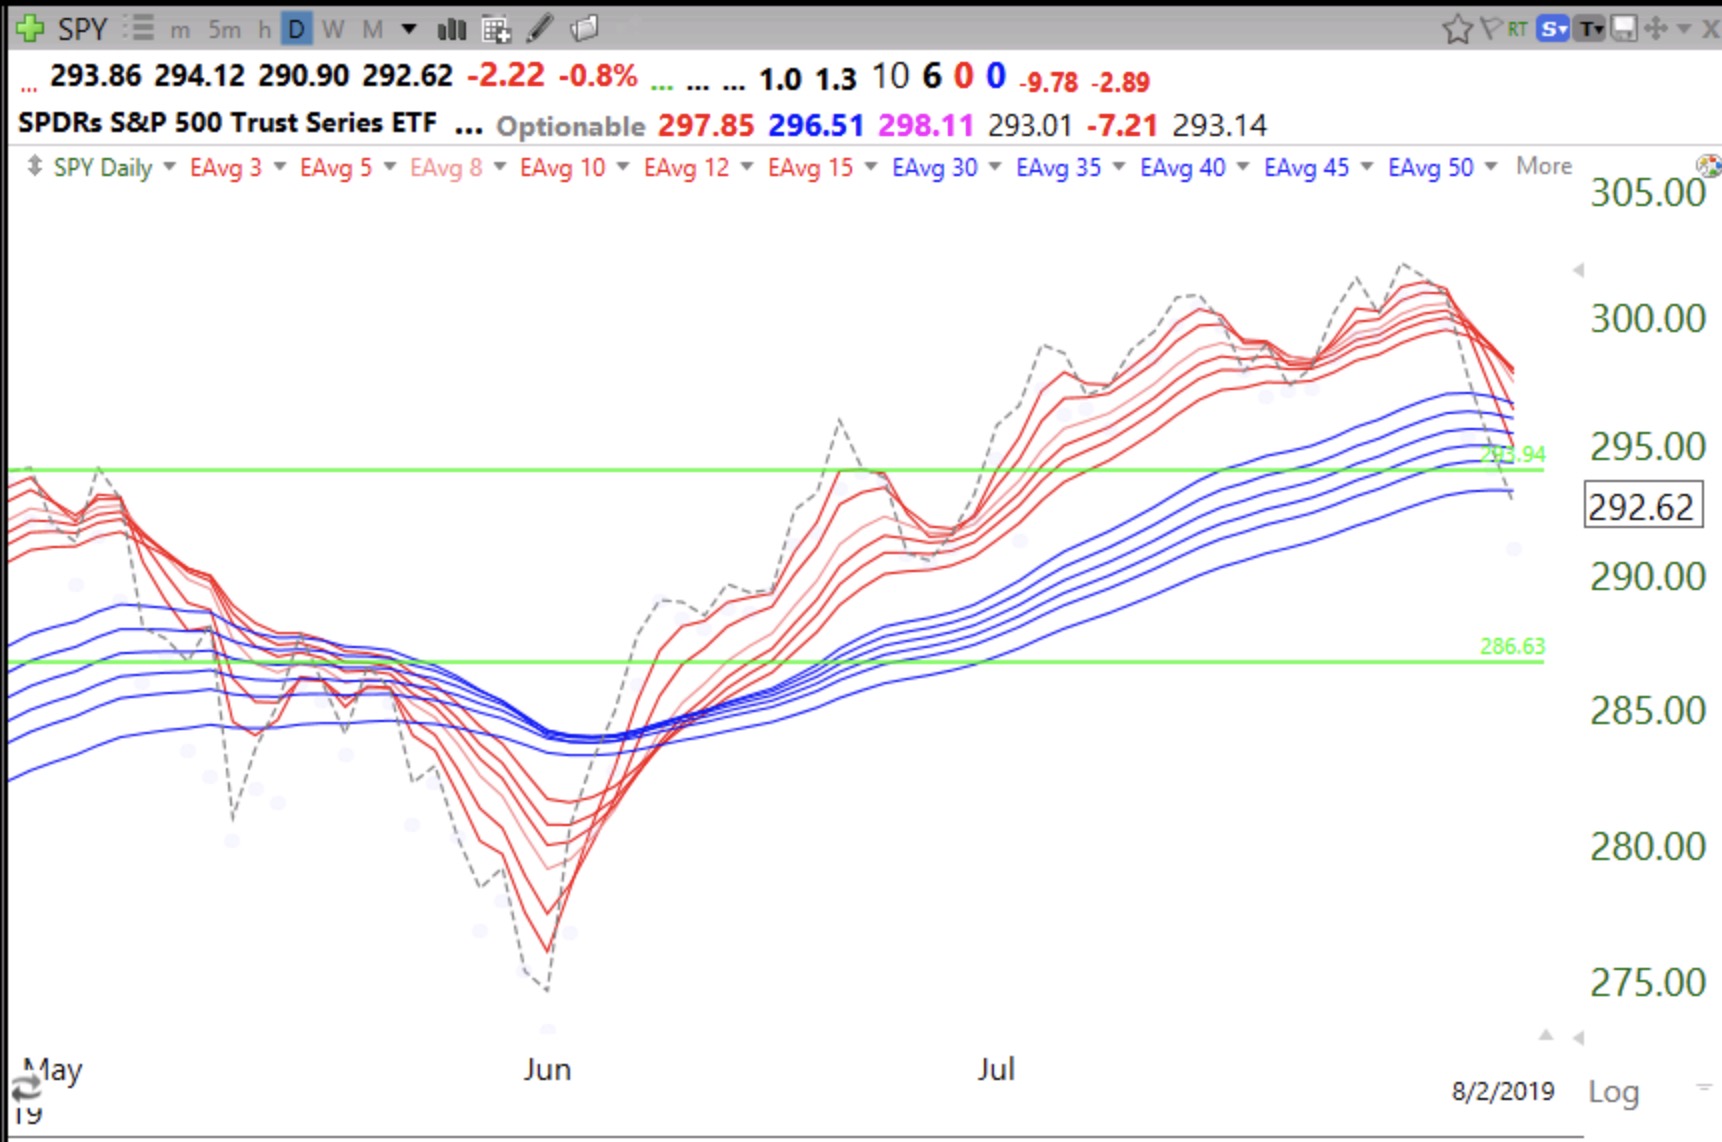
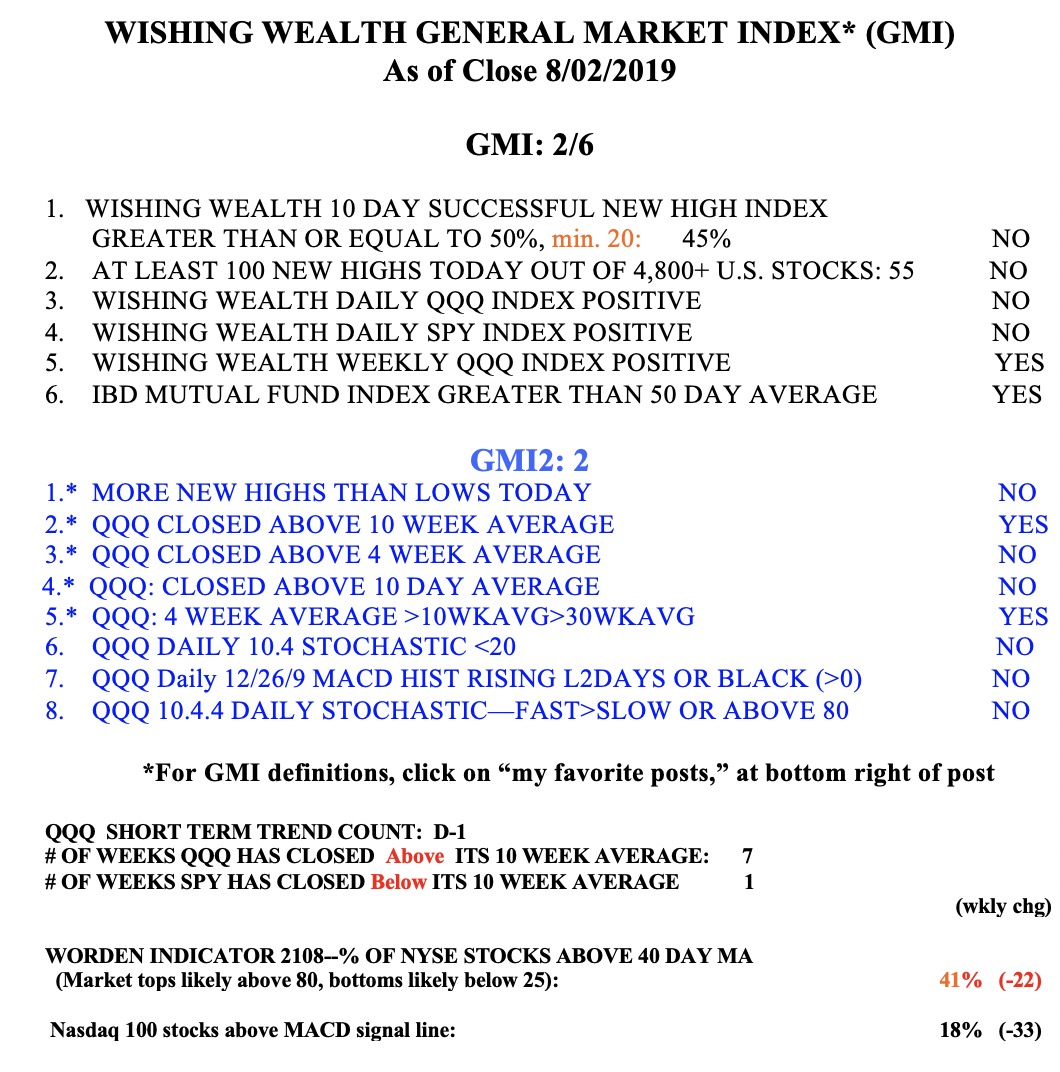
The SPY has closed below its 10 week average and the SPY, DIA and QQQ have closed back below their recent GLBs, a major sign of weakness. the GMI has declined to 2 (of 6). Another day below 3 will turn the GMI to a Red signal.