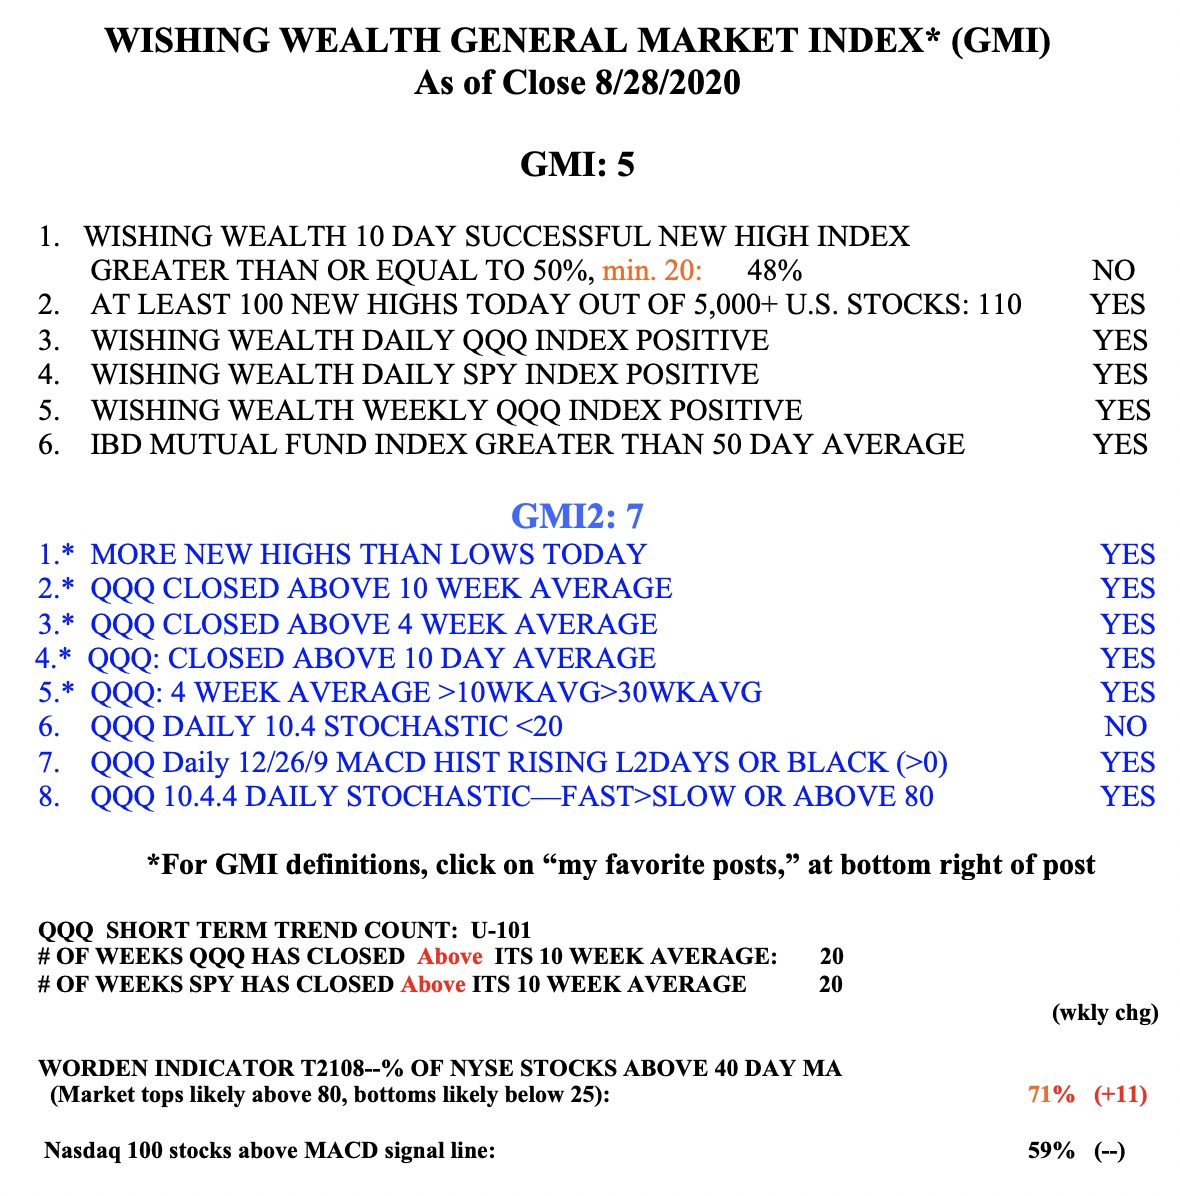
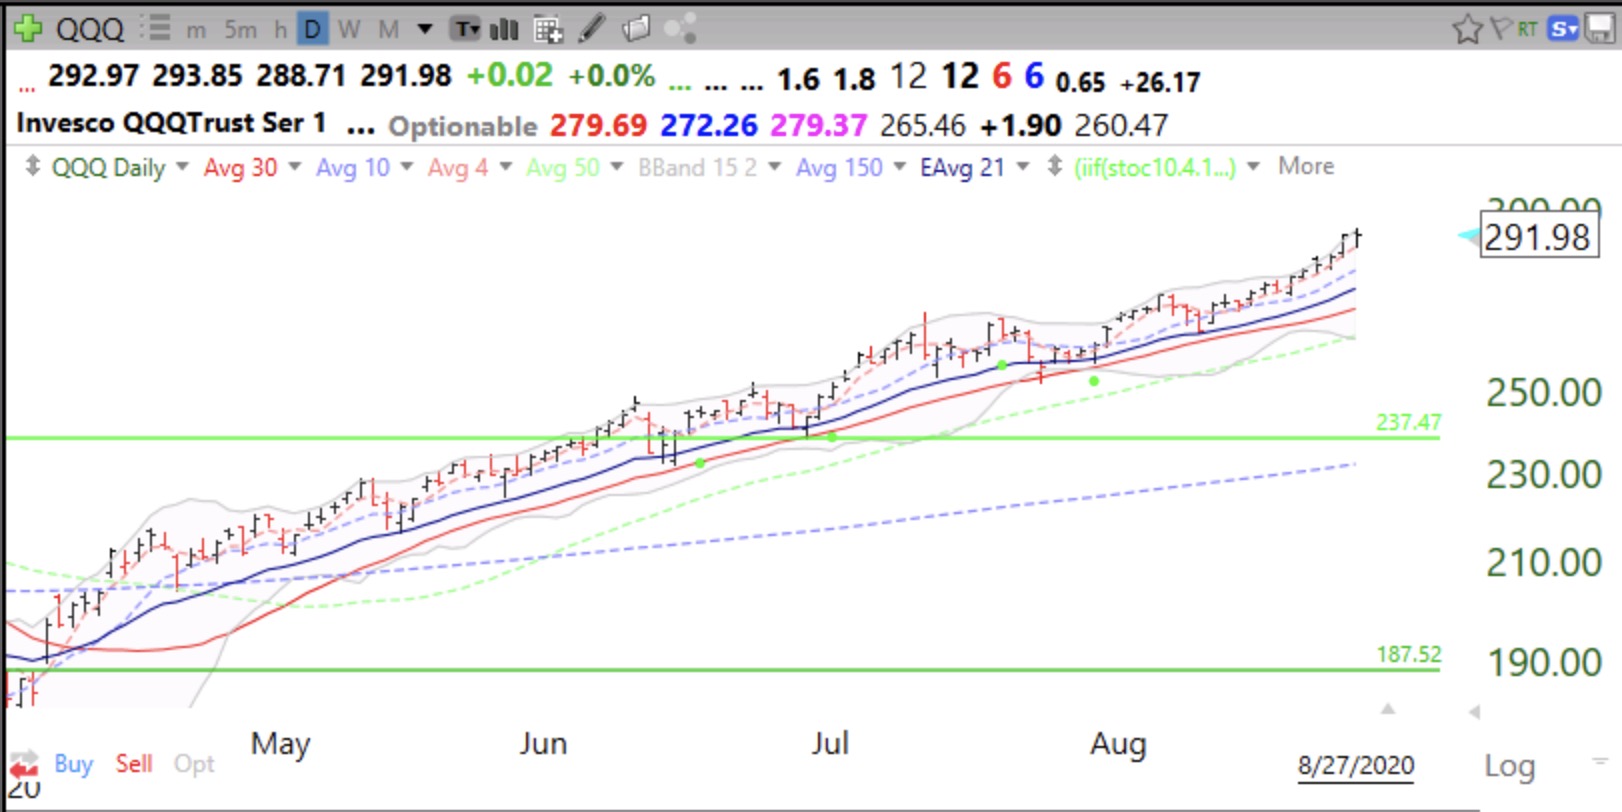
Skip to content

Wishing Wealth Blog

Stock Market Technical Indicators & Analysis

  • Home
  • About
    • Disclaimer
    • Contact
  • Recommended Reading
  • Topics
    • General Market Index (GMI) table
    • Nicolas Darvas
    • My Favorite Posts
    • Tutorial
    • UMDSMC Education Posts
    • Video blog
  • Webinars
    • 2026-04 MoneyShow Virtual Booths
    • TraderLion 25 Annual Conference
    • 2025-07-17 Long Island Traders Meetup
    • Boston IBD Meetup, May 21, 2025
    • 01/2024 NoVA IBD Meetup
    • AAII
      • Eastern Michigan – 01/2022
      • Research Triangle – 12/2021
    • 2021 TraderLion Presentation
    • 2022 TraderLion Webinar
    • TC2000 User Group – December 2012
    • 2012 Houston TC2000 Webinar
    • Doctor’s Orders – August 2010
    • A Word from Dr. Wish – April 2010
    • Other Dr. Wish Videos…
  • Glossary
  • $25 Coupon for TC2000

All Posts

$SPY remains in daily RWB up-trend (as do $DIA and $QQQ)

Thursday, July 16, 2020 @ 10:36 pm by Dr. Wish
GMI5/6
GMI-26/9
T210856%

Leave a comment

$RH moves up from green line to ATH, has green dot signal

Wednesday, July 15, 2020 @ 9:40 pm by Dr. Wish
GMI6/6
GMI-26/9
T210859%

1 Comment

68th day of $QQQ short term up-trend

Tuesday, July 14, 2020 @ 10:21 pm by Dr. Wish
GMI5/6
GMI-27/9
T210846%

Leave a comment
Older posts
Newer posts
← Previous Page1 … Page322 Page323 Page324 Page325 Page326 Page327 Page328 … Page1,393 Next →

Current GMI Signal

GREEN

since close on APR 10, 2026

Successful GLBTracker

Selected stocks that have had a successful recent Green Line Breakout (GLB). One can really profit by buying stocks breaking out to all-time highs after a consolidation of 3 months or more, my GLB Setup.

Sym.DateGLB $Now $Chg.
ENLT6/18/25$20.44$94.98364.68%
SFM1/29/24$49.45$80.9863.76%
CRS4/23/24$79.66$485.12508.99%
AGX9/6/24$76.70$689.51798.97%
SATS8/26/25$50.21$122.84144.65%
APP9/17/24$116.09$566.53388.01%
EAT10/1/24$78.33$135.4072.86%
PLTR11/5/24$44.91$141.40214.85%
ALMS1/6/26$13.53$20.4951.44%
BE8/22/25$44.95$290.23545.67%
CLS5/1/25$87.00$421.12384.05%
RGC5/1/25$1.55$22.601358.06%
CCJ6/9/25$62.55$113.8281.97%
RHLD8/12/25$54.05$114.87112.53%
GEV5/20/25$447.50$958.20114.12%
CLS6/25/25$144.27$421.12191.90%
MIRM8/7/2025$54.23$93.3972.21%
CCJ6/9/25$62.55$113.8281.97%
WDC9/4/25$86.66$590.42581.31%
SNDK9/4/25$58.36$1,820.723019.81%
STX6/3/2025$117.67$932.46692.44%
TTMI6/3/25$30.41$187.38516.18%
MU9/29/25$157.54$1,018.69546.62%
INBX7/8/25$18.95$91.43382.48%
SPHR9/11/25$56.08$142.31153.76%
FIX7/24/25$553.09$1,888.17241.39%

Indicators in your Inbox

Get new posts by email:
PopularMost DiscussedRecent
  • About the General Market Index (GMI)
  • Welcome to the new *and improved* Wishing Wealth
  • How to use IBD 100 and New America stocks and TC2007 to find potential rocket stocks; Market rally begins
  • The new 3x ETF’s–triple your pleasure — or pain
  • 6th day of $QQQ short term down-trend; GMI could signal a Buy
  • In the hospital. Will resume posting next week. Thank you for your patience.
  • How I use put options as investment insurance
  • My first YouTube Vlog (video blog) Post: Sell in May and Go Away?
  • So, Wishing Wealth Reader, Tell Us About Yourself…
  • Blog post: David, my co-presenter, brilliant colleague of 20+ years died in a freak accident on 2/18; Day 35 of $QQQ short term down-trend; 15 promising stocks to monitor
  • The same chart pattern I posted yesterday for the 2000 top also got me out of the market just before the 2008 decline. Market tops take time to develop. I ignore the news and gossip and watch the 30 week average.
  • HOW I IDENTIFIED AND EXITED AT THE MARKET TOP IN 2000–WHEN THE 30 WEEK AVERAGE CURVED DOWN. TO IDENTIFY A LIKELY TOP, I JUST WATCH THE 30 WEEK AVERAGE. Compare the weekly charts of QQQ from 2000 and now.
  • Blog: Day 36 of QQQ short term up-trend; I am amazed how strongly advancing stocks and ETFs may track along their 5 day exponential moving average, see daily charts of QQQ and DELL.
  • Blog Post: Day 32 of QQQ short term up-trend; GMI=5 (of 6) and GREEN. 15 of 62 stocks reaching ATH on Friday were semiconductors. They lead again and 5 had a GLB! See list and note earnings release dates.
  • Blog Post: Day 31 of QQQ short term up-trend; $ALAB holds GLB, see daily chart. Must not close below 262.90. Note high volume on break-out.

Blogroll

  • Barchart All-Time Highs
  • Blue Collar Investor
  • CNNMoney: Pre-market Futures
  • Dark Liquidity
  • Seeking Alpha
  • Stock Chartist

Recommended Reading

QQQ and TQQQ ETF Profit Machine Momentum Masters - A Roundtable Interview with Super Traders - Minervini, Ryan, Zanger & Ritchie II Alan Ellman's Selling Cash-Secured Puts: Investing to Generate Monthly Cash Flow Stock Investing For Students - a plan to get rich slowly and retire young Trade Like a Stock Market Wizard: How to Achieve Super Performance in Stocks in Any Market Exit Strategies for Covered Call Writing: Making the Most Money When Selling Stock Options Complete Encyclopedia for Covered Call Writing Wall Street The Other Las Vegas How to Make Money in Stocks: A Winning System in Good Times and Bad, Fourth Edition Trend Trading: A seven step approach to success How Legendary Traders Made Millions: Profiting From the Investment Strategies of the Gretest Traders of All time The Complete TurtleTrader: The Legend, the Lessons, the Results How to Make Money Selling Stocks Short Reminiscences of a Stock Operator Stan Weinstein's Secrets For Profiting in Bull and Bear Markets Lessons from the Greatest Stock Traders of All Time How I Made $2,000,000 In The Stock Market

Archives

© 2026 WishingWealthBlog.com

Loading Comments...