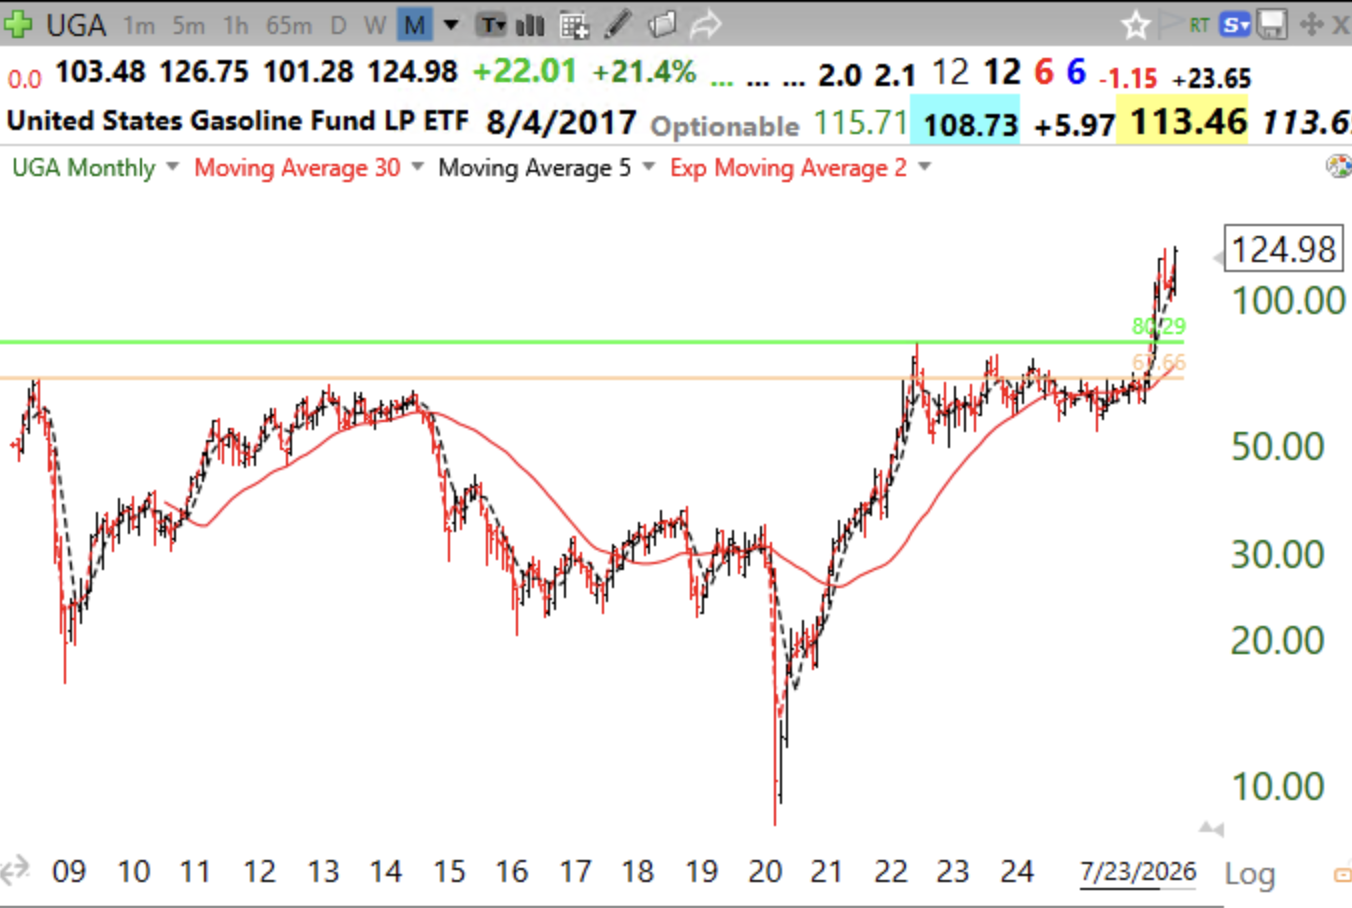
UGA tracks gasoline futures. This is an interesting ETF in current times. I missed the GLB in March because I don’t regularly scan ETFs for GLBs. Is the ETF about to run out of gas????? (I couldn’t resist this pun.)
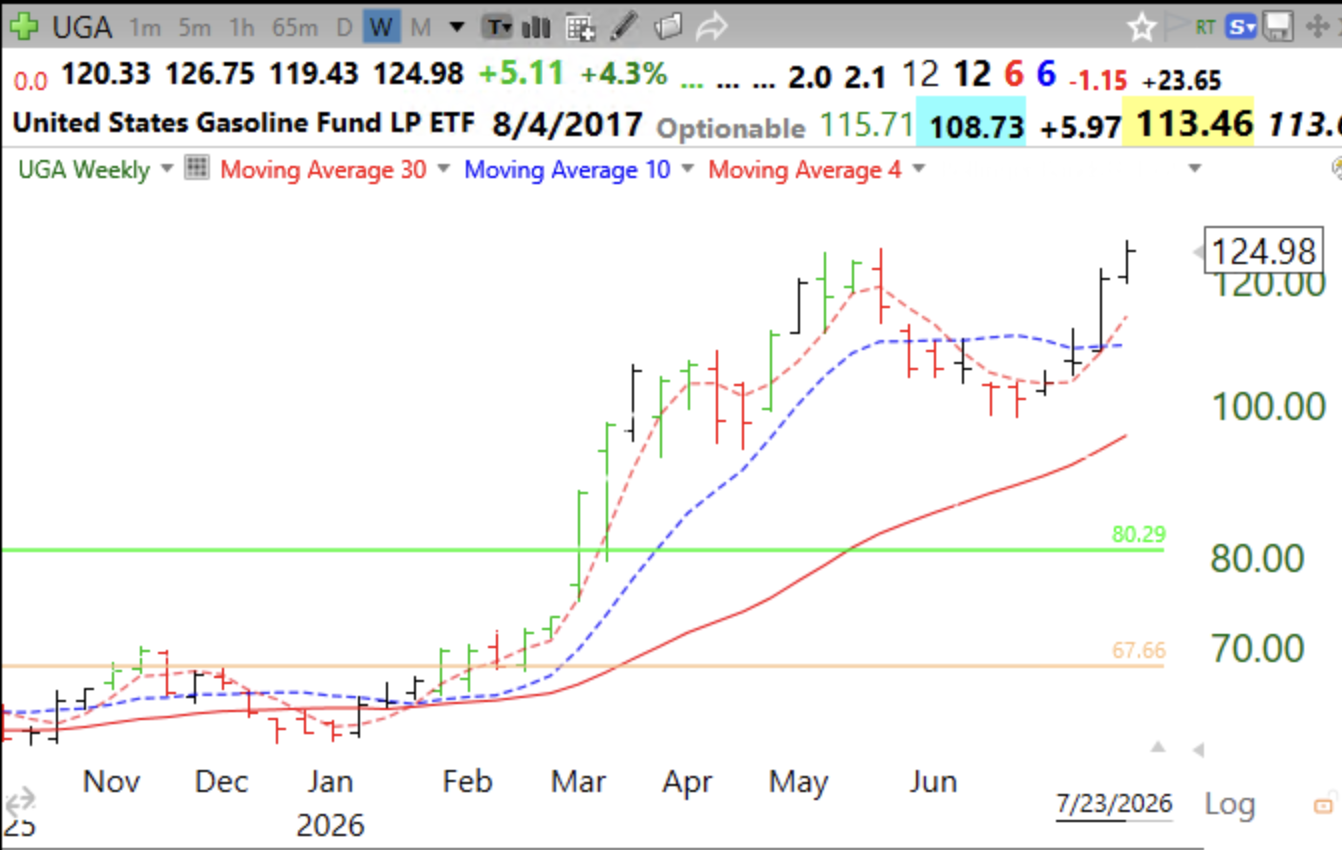
Here is its monthly chart. Prior green line was changed to orange.