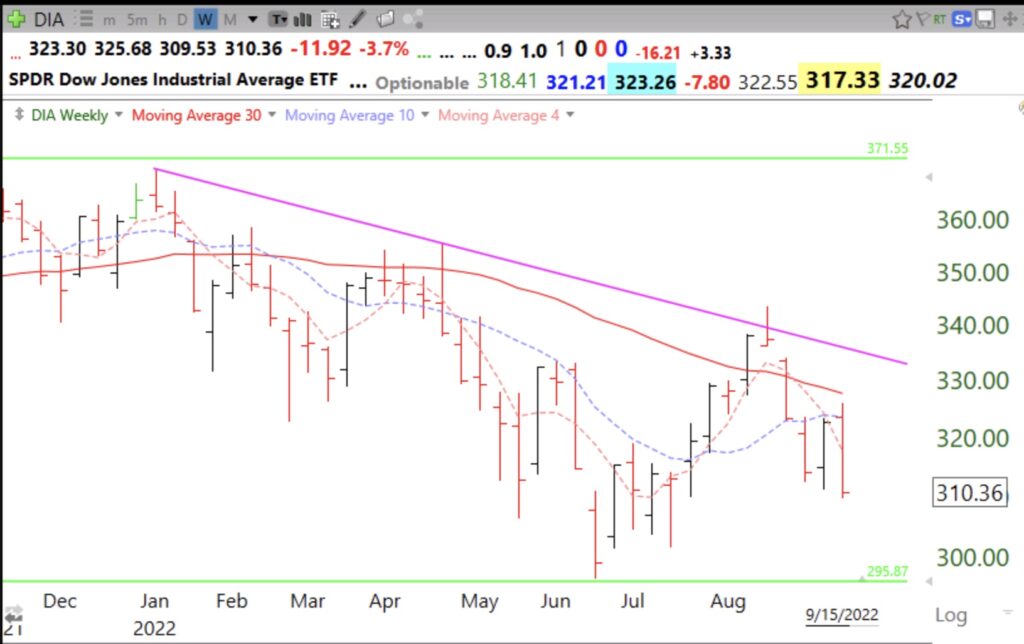
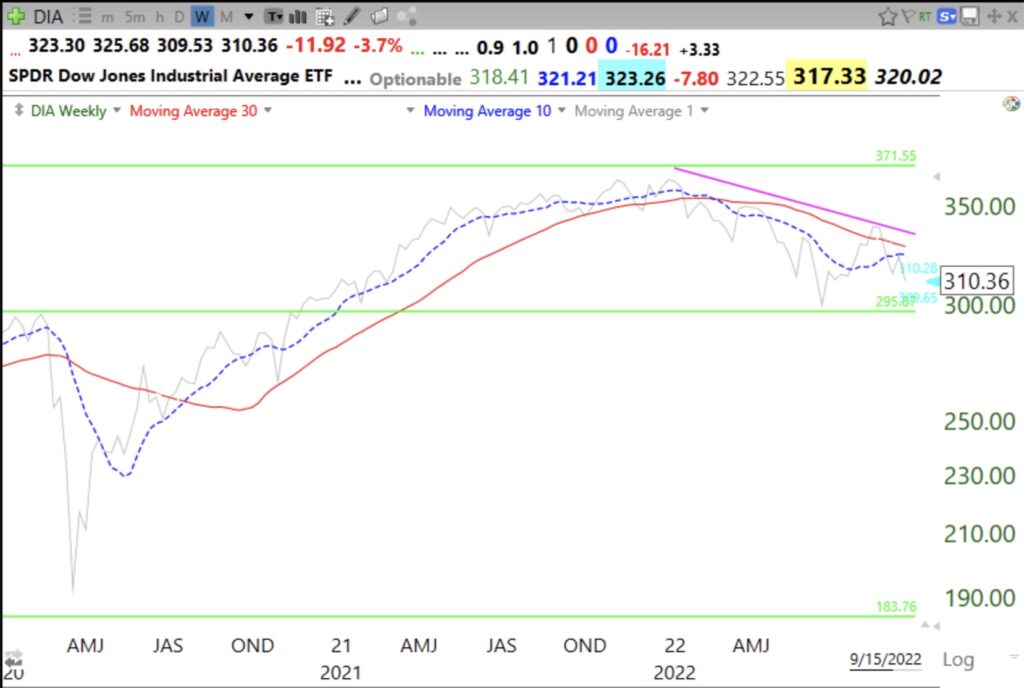
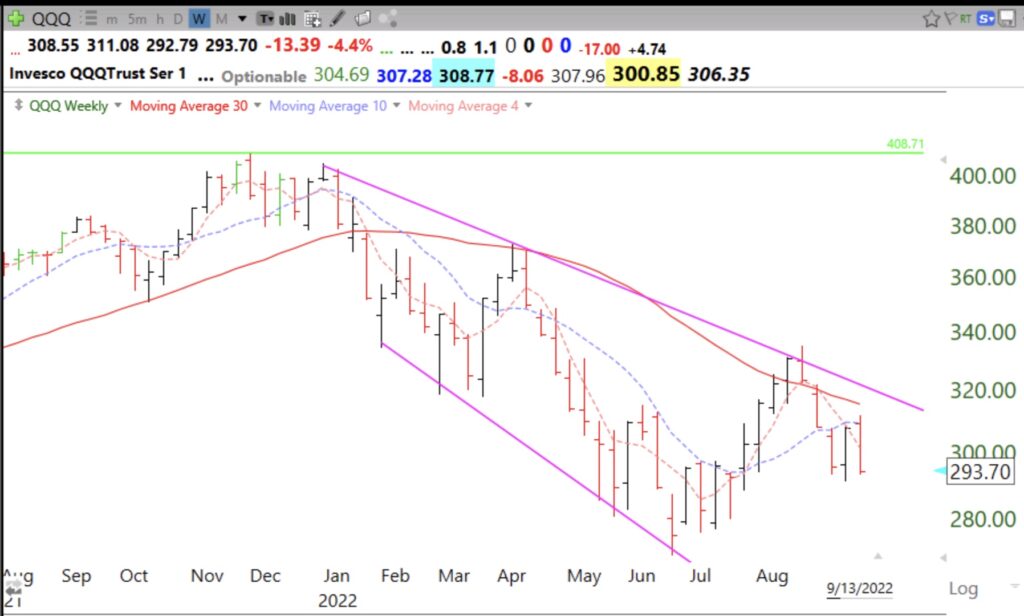
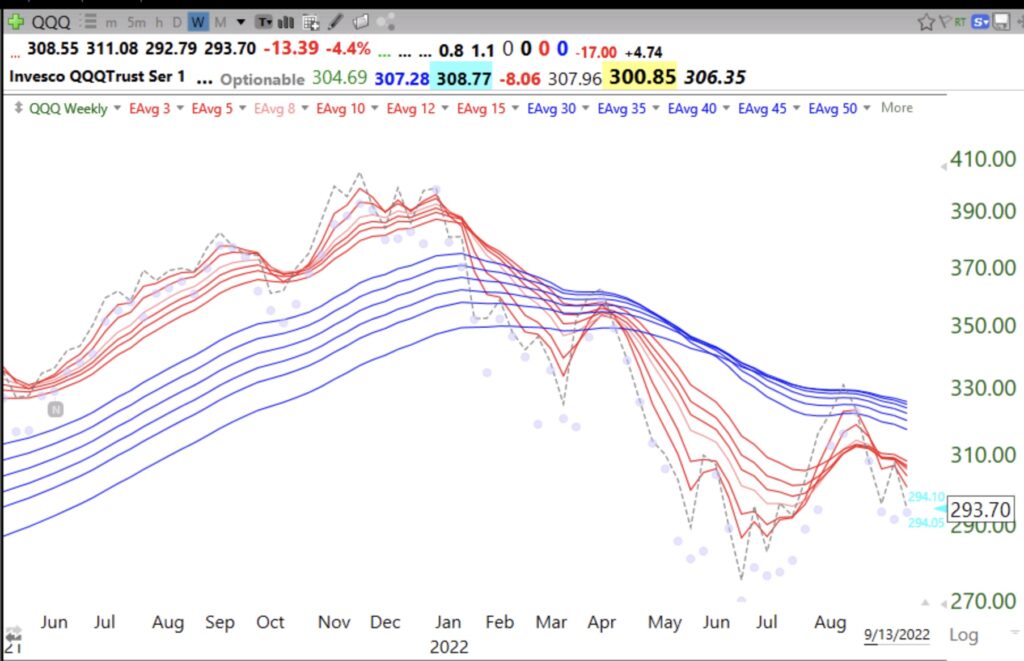
Market could fall to last green line break-out at 295.87 (GLB) which occurred after the pandemic decline, in November, 2020. A decline below that green line could induce heavy selling and a market bottom. But we do not need to predict, just to react after a bottom is firmly in. But how will we know that?
Looking back to the 2020 bottom, this weekly 10:30 chart of DIA shows how to discern a bottom. The 10 week average (dotted line) turns around and climbs above the 30 week average. Once that happened one had 1.6 years to ride the up-trend until the 10 week average closed back below the 30 week, see chart below. One does not have to catch the bottom. Wait until it is in place before risking one’s fortune by going long.
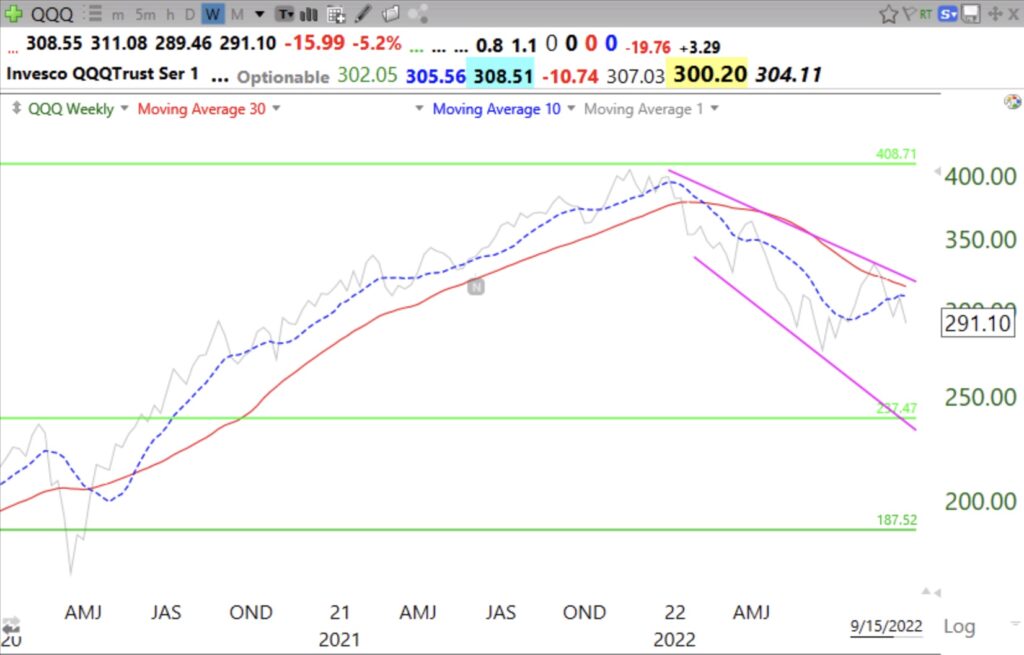
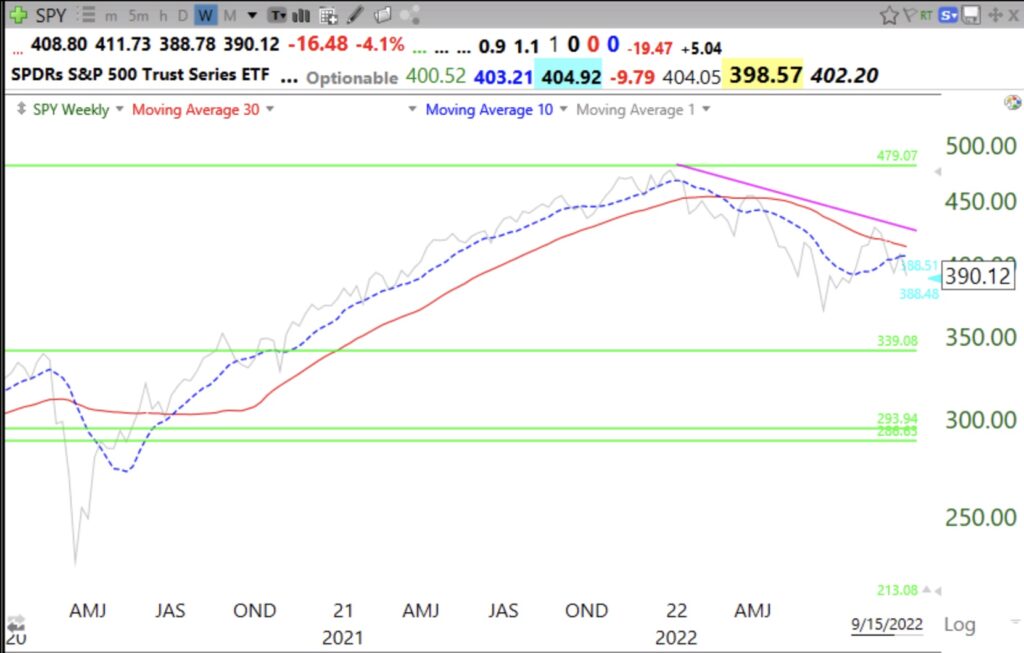
Here are similar charts for QQQ and SPY. Same patterns. So sit back in cash or treasury bills and wait. Sitting is the hard part, as Jesse Livermore more eloquently said. (The gray line in the charts is the weekly closing price.)
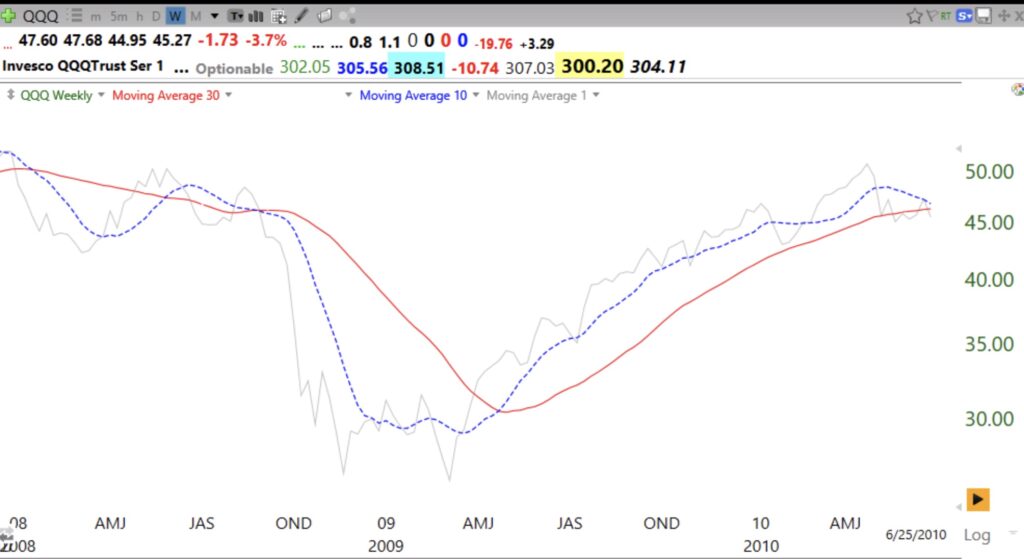
For you skeptics, here is the 2009 bottom in QQQ. There was an earlier head fake in 2008. When that happens you get in and then exit when it fails. The gray line should remain above the 30 week average. In 1929, Bernard Baruch got in and out of the market several times until he correctly nailed it by going short.
Not using charts before one invests is like driving to an unfamiliar location without a GPS, or waze……….
