I am nibbling on TQQQ and will accumulate more if the new short term up-trend persists. Fed to meet this week and volatility may be high. I am recovering from Covid and keeping it brief tonight.
Stock Market Technical Indicators & Analysis
I am nibbling on TQQQ and will accumulate more if the new short term up-trend persists. Fed to meet this week and volatility may be high. I am recovering from Covid and keeping it brief tonight.
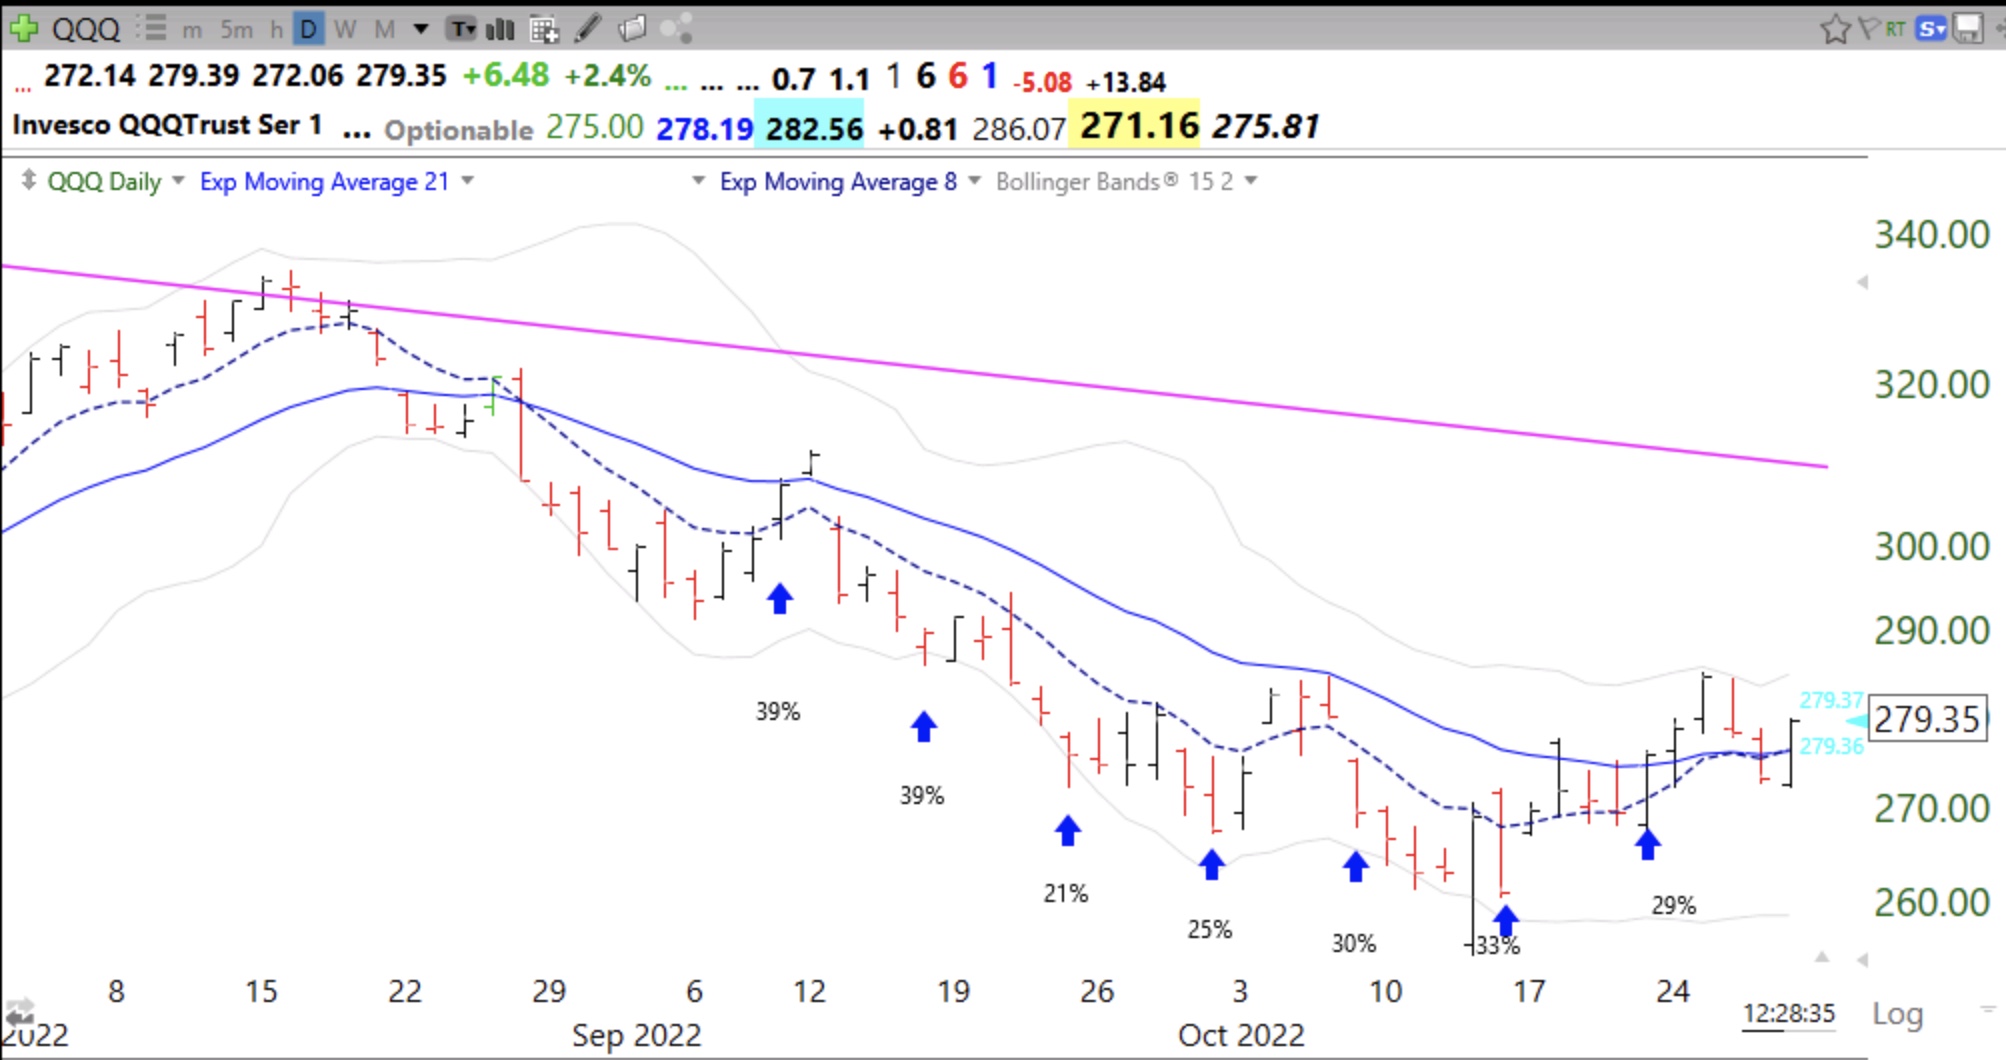
Shown in this daily chart of QQQ is the percentage bullish on QQQ based on a weekly poll of my freshmen class of 123 students. They are learning how a contrarian indicator functions.