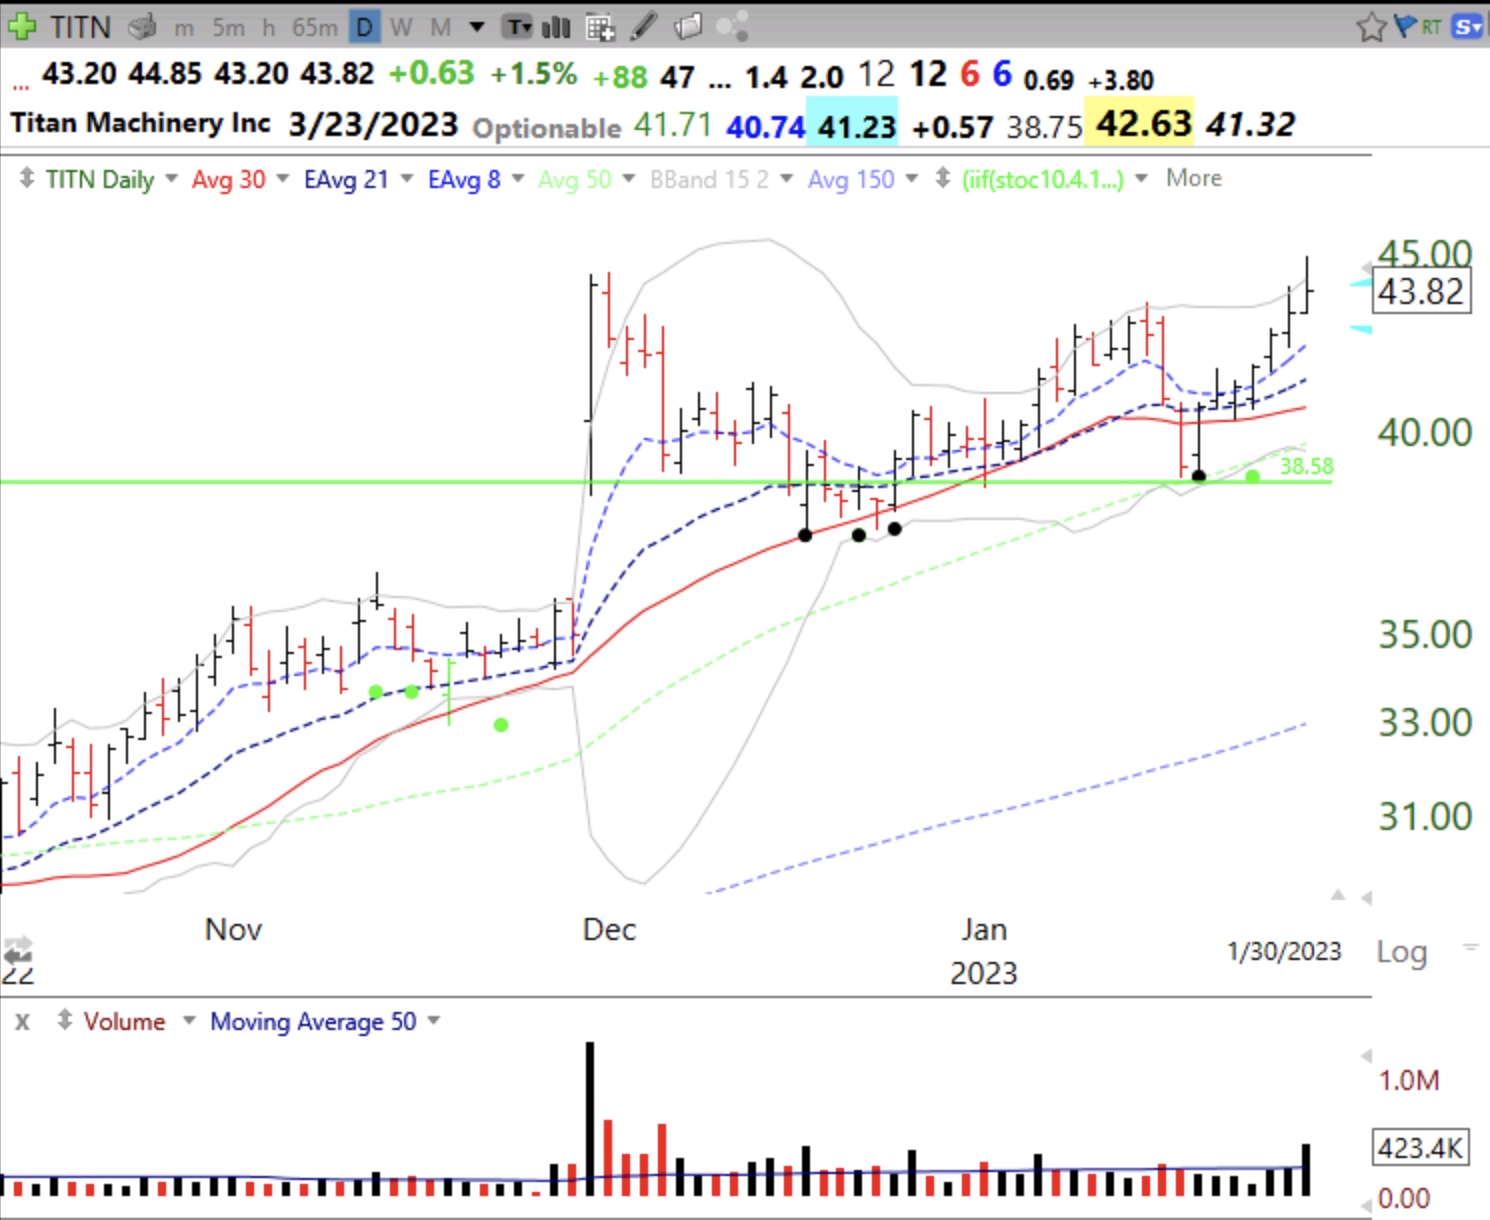
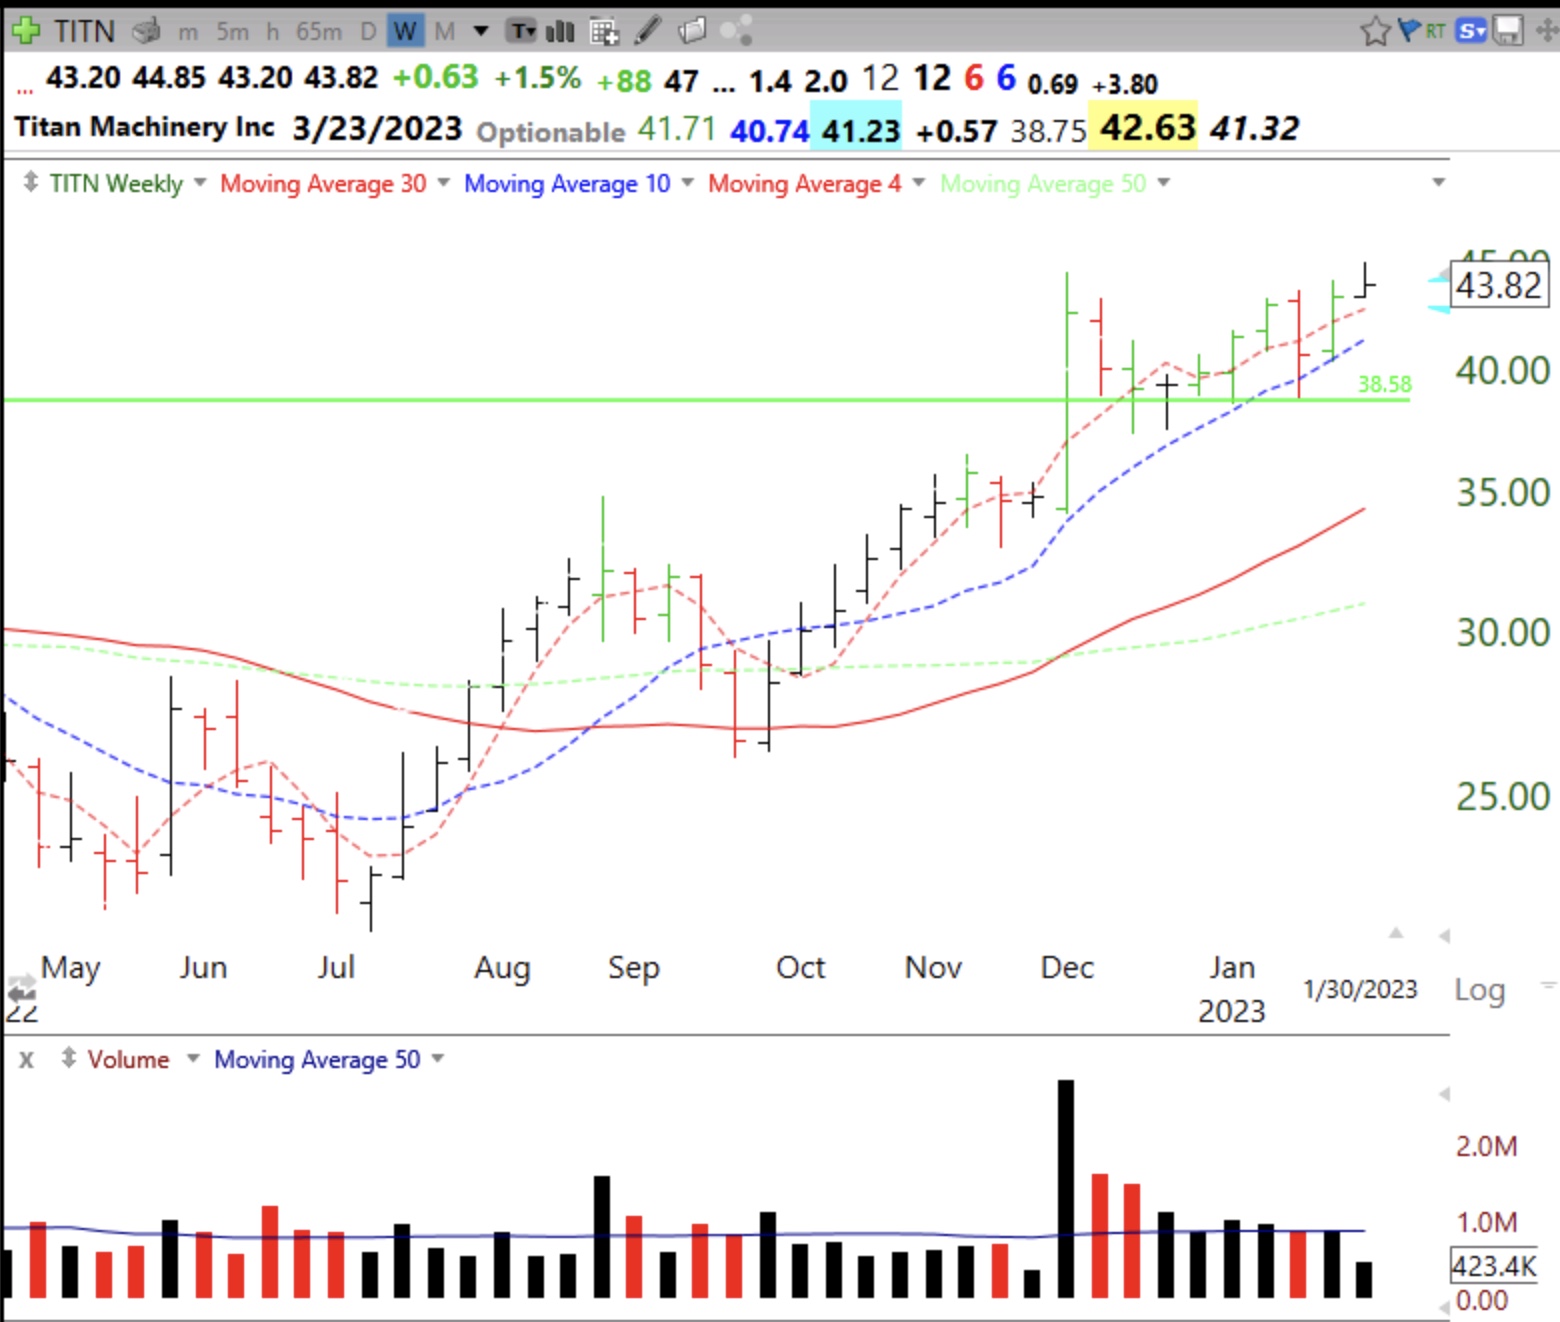
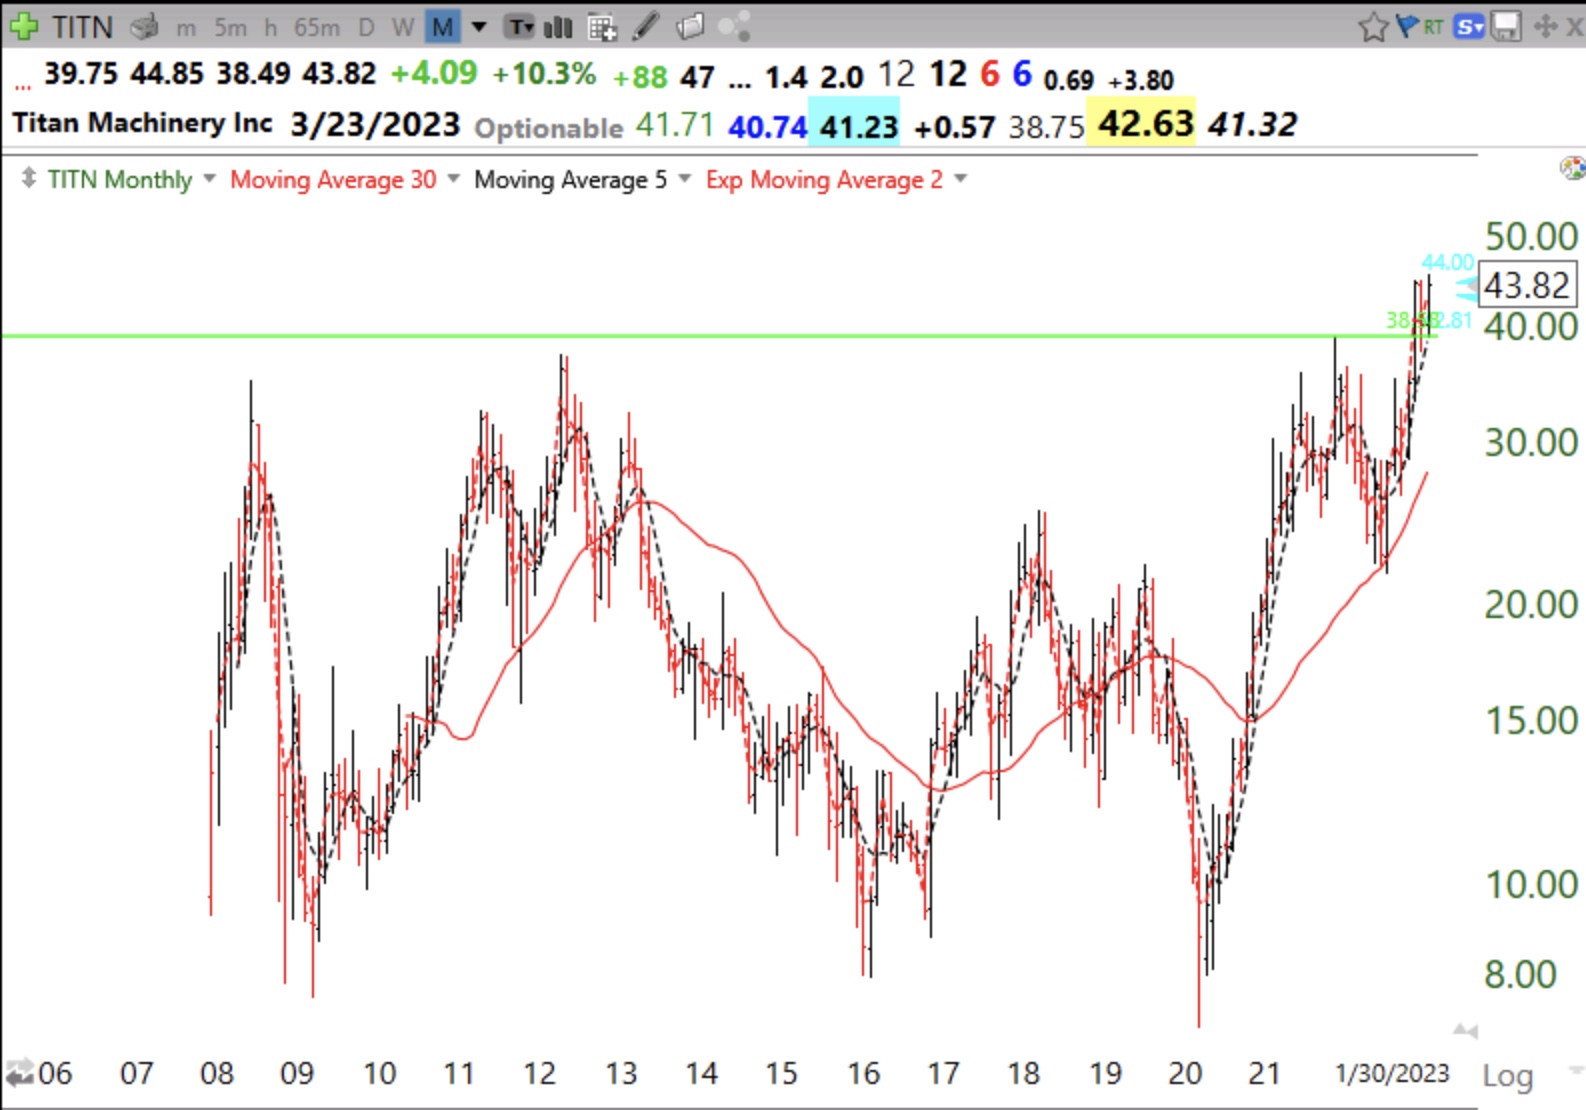
Blog post: $QQQ, $DIA meet resistance at 30 week average; $SPY holds just above; Failure to hold 30 week average could portend significant Stage 4 decline, see weekly charts

GMI6/6
GMI-25/9
T210856%

Failure to hold above a declining 30 week average is a very ominous sign of weakness.   Too many break-outs are failing.  End of quarter mutual fund window dressing is over. Time to be defensive on the sidelines and wait for the signal. The market should reveal its major trend in a week or so.


Blog post: GMI= 6 (of 6) and Day 8 of $QQQ short term up-trend; 10/30 weekly naked chart reveals index and stock trends

GMI6/6
GMI-26/9
T210865%

A strong up-trend is characterized by the 10 week average rising  consistently above the 30 week average. This chart shows just these 2 averages without the price bars (naked). Compare the 2020 bottom with the recent pattern. We are not there yet. To be in an up-trend the 10 week average needs to rise above the rising 30 week average. Look how well one would have done to have owned QQQ only when the 10 week average was above the 30 week. See below some examples of how this strategy applies to stocks, indexes and commodities. It is a great way to avoid being shaken out of a position by the daily volatility.

Look how it would have helped you trade PTON , ZM, MRNA, GLD, DBC.