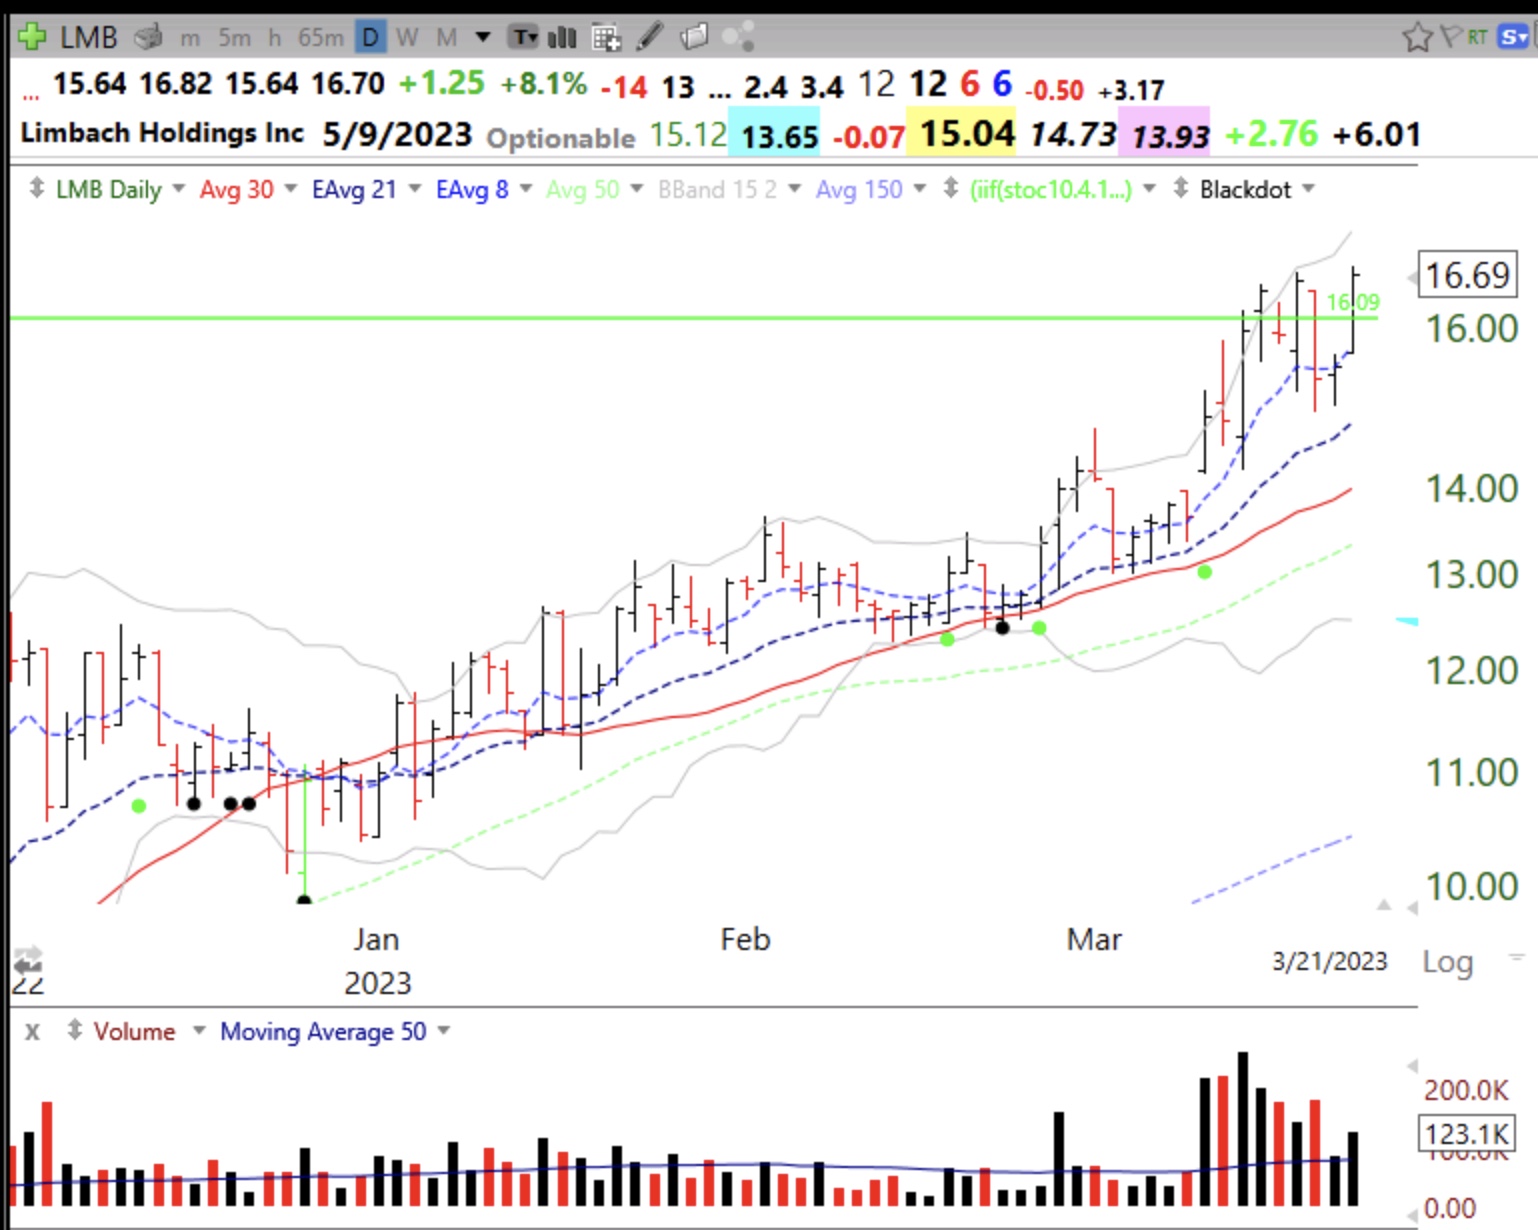
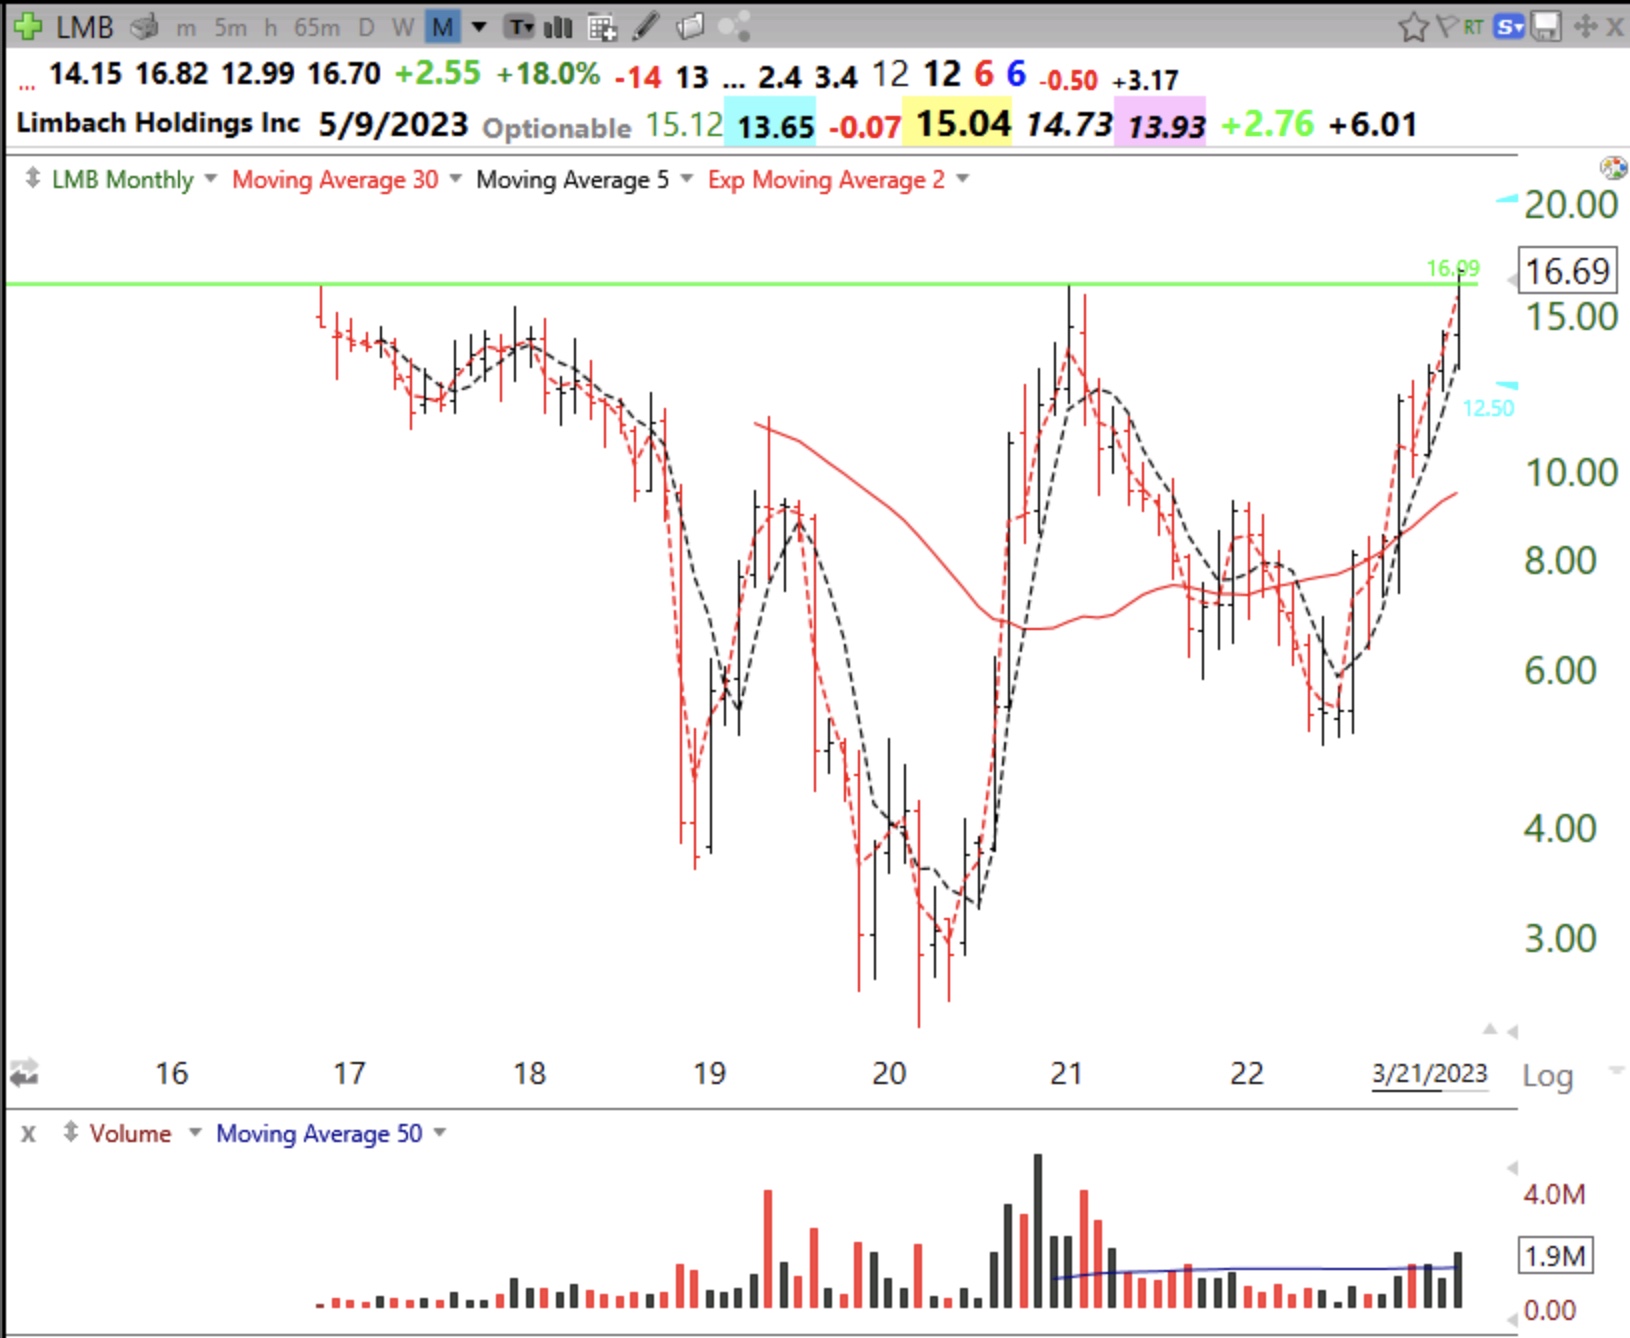
LMB retook its green line on Tuesday.Note the recent above average trading volume. It is worth watching.
Stock Market Technical Indicators & Analysis
LMB retook its green line on Tuesday.Note the recent above average trading volume. It is worth watching.
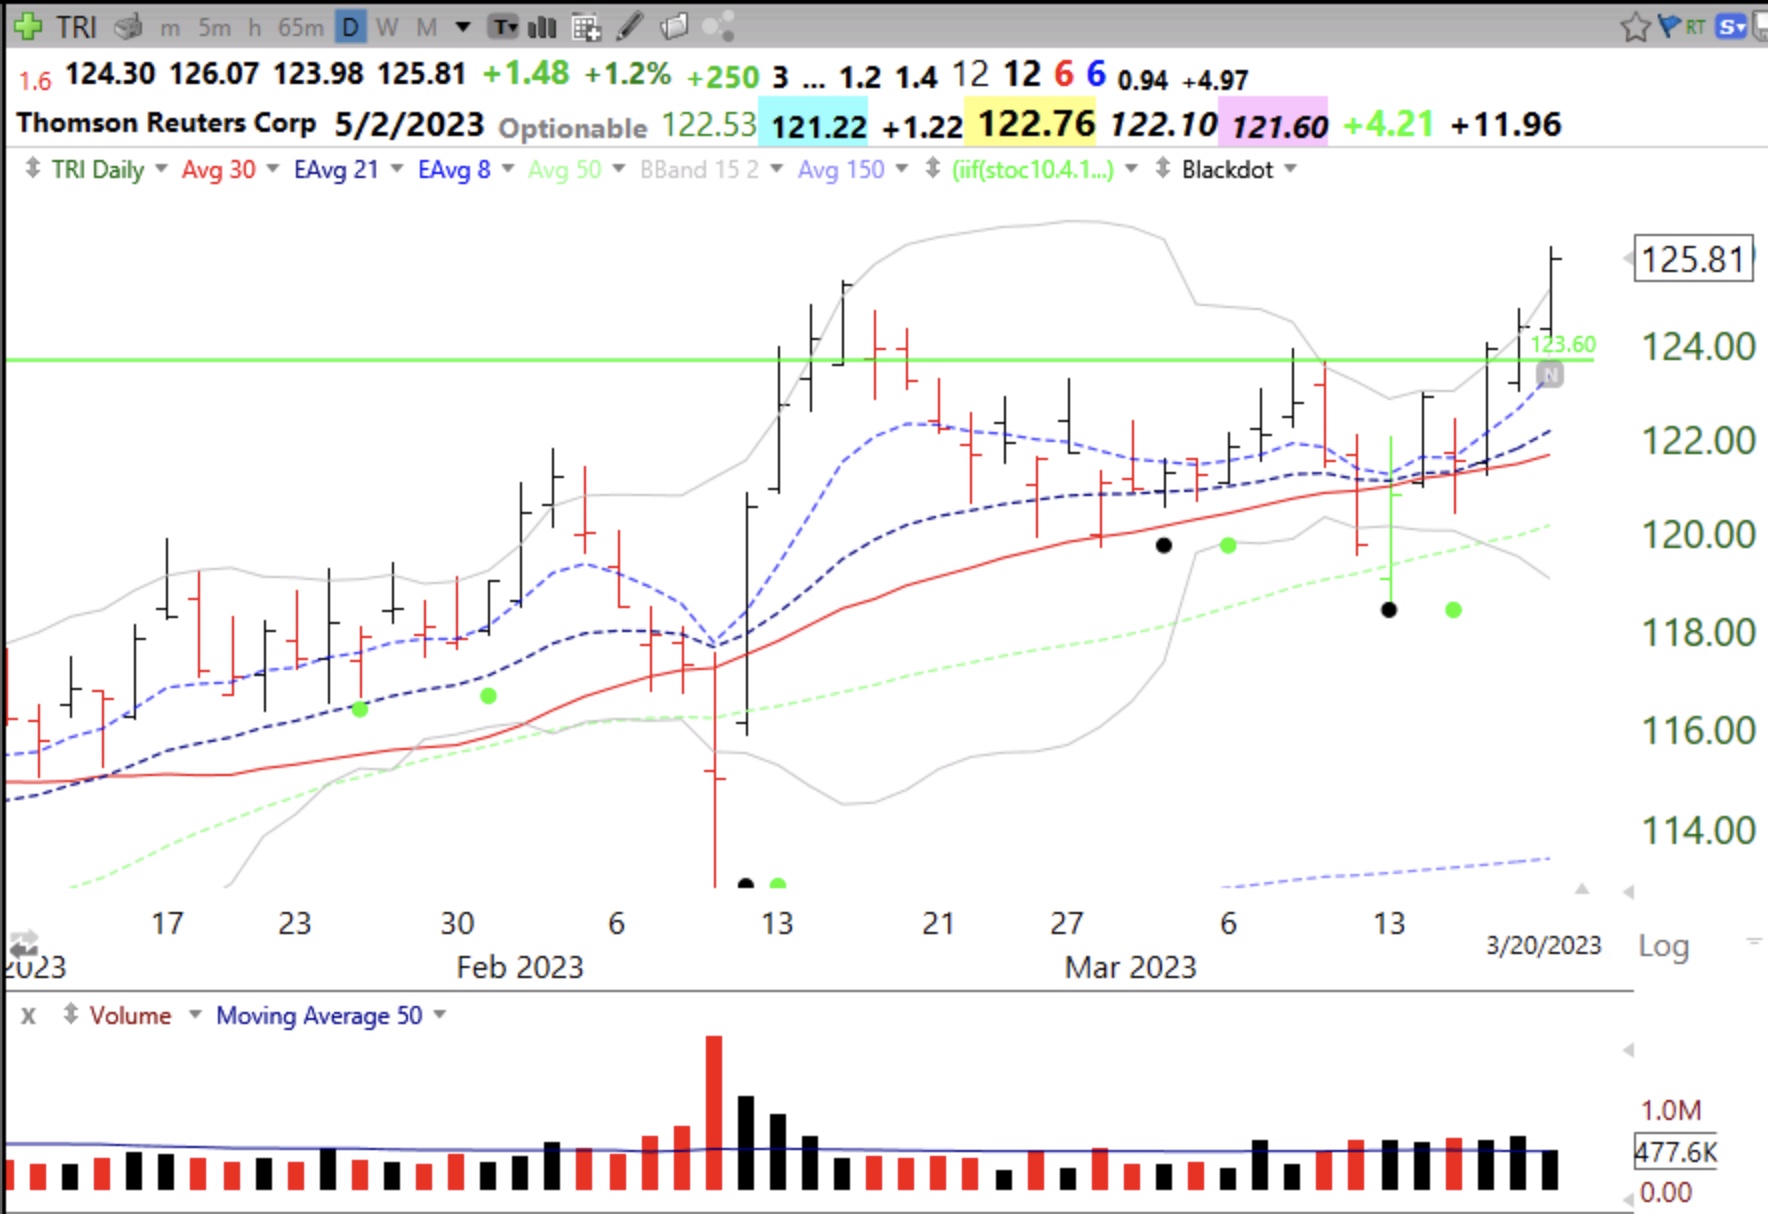
Only 5 of 7,000 stocks reached an ATH on Monday. One fo them, TRI, did so after a recent GLB. (I couldn’t resist buying a little.)
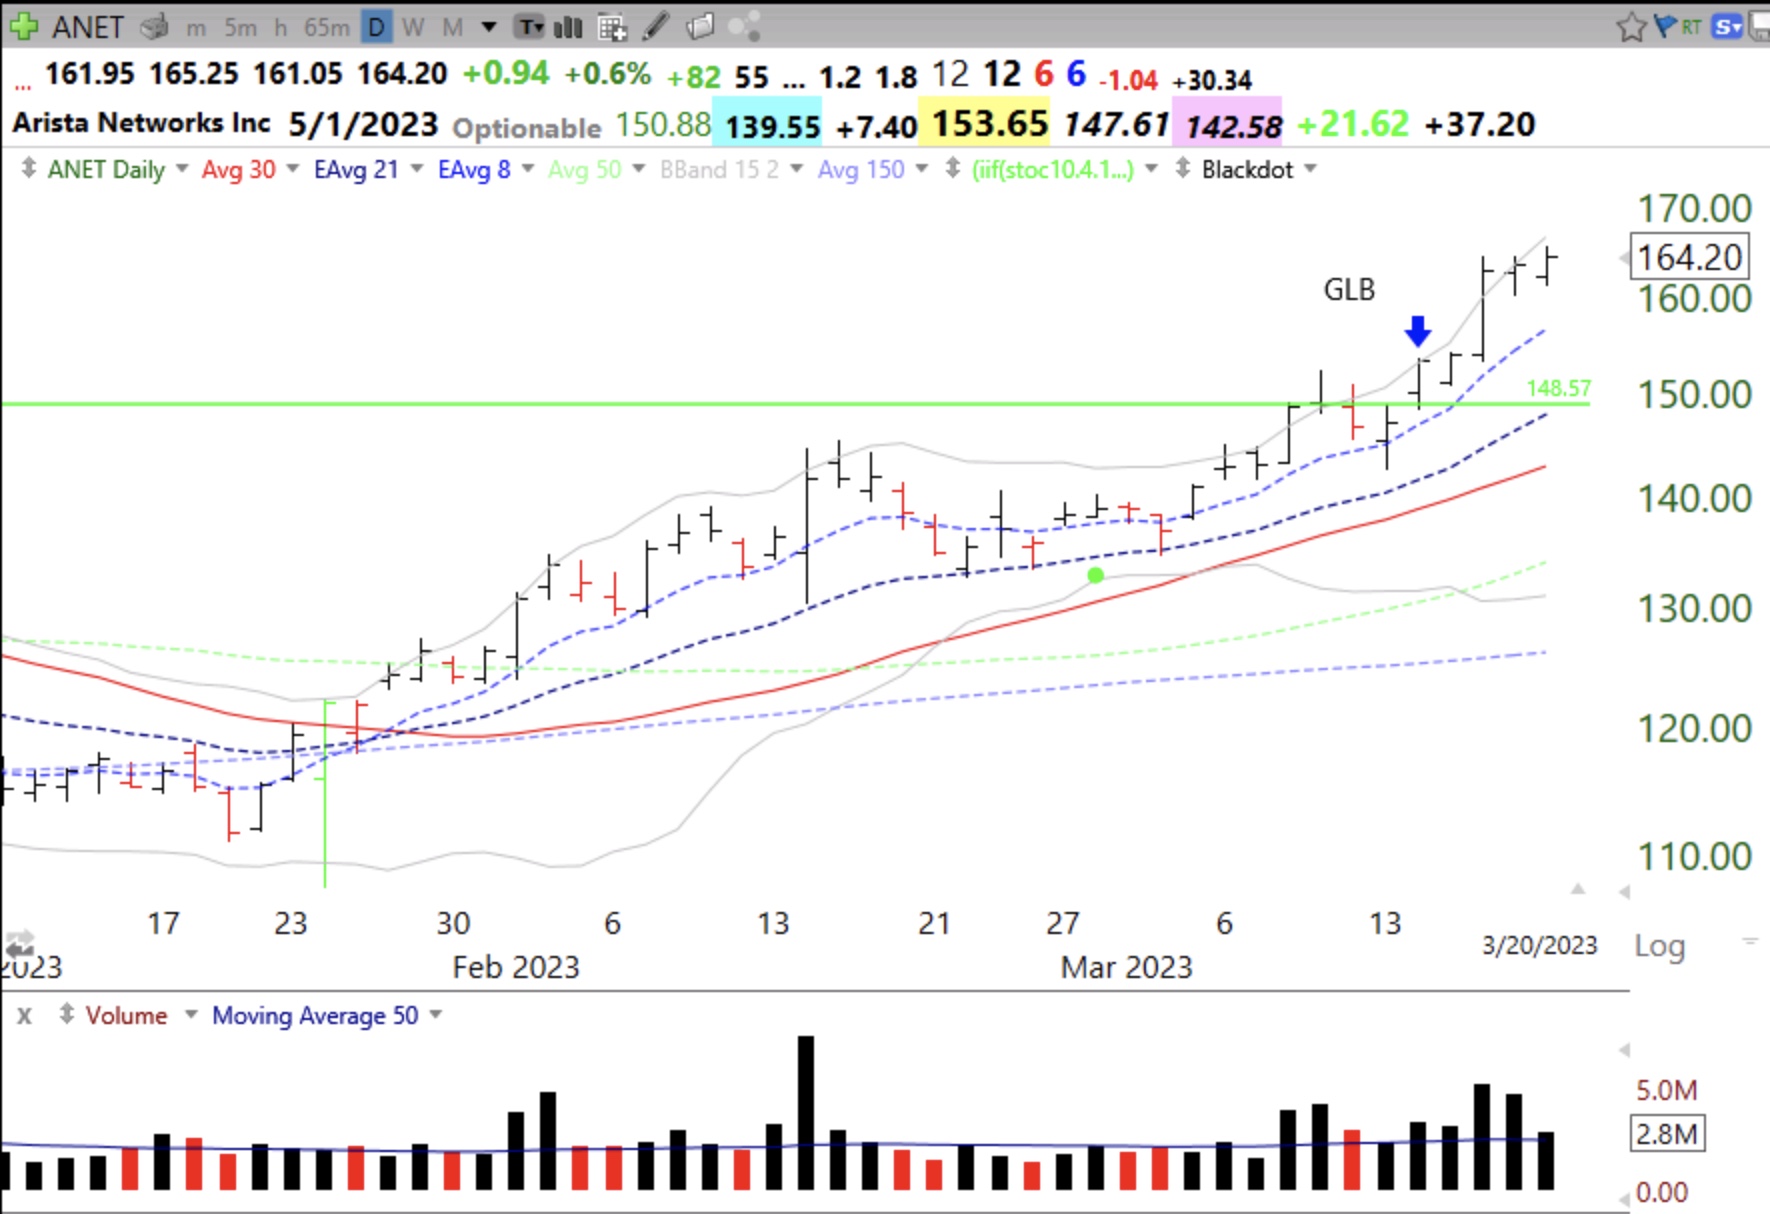
Another was $ANET
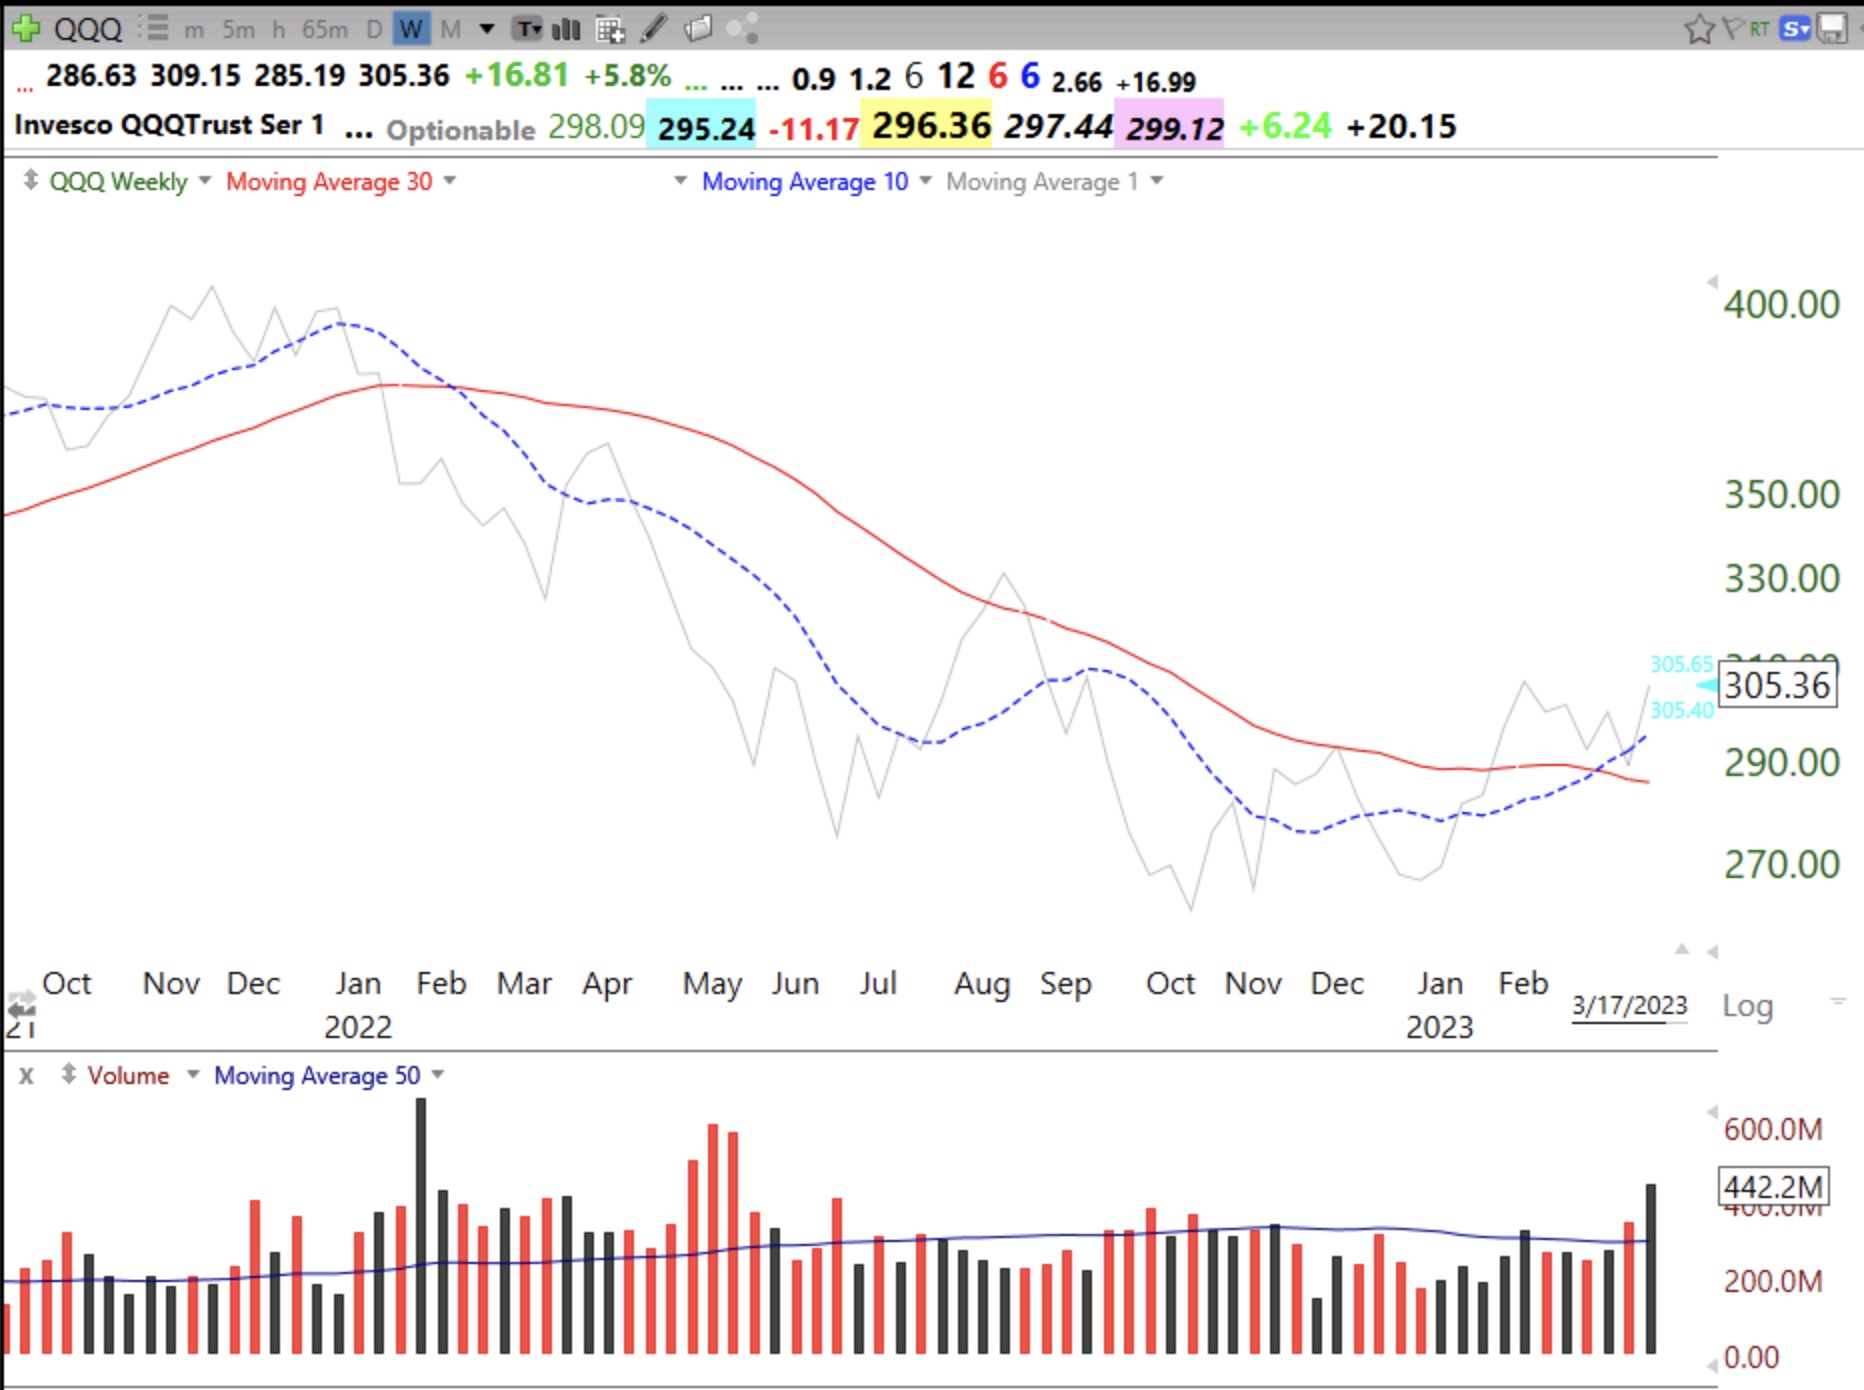
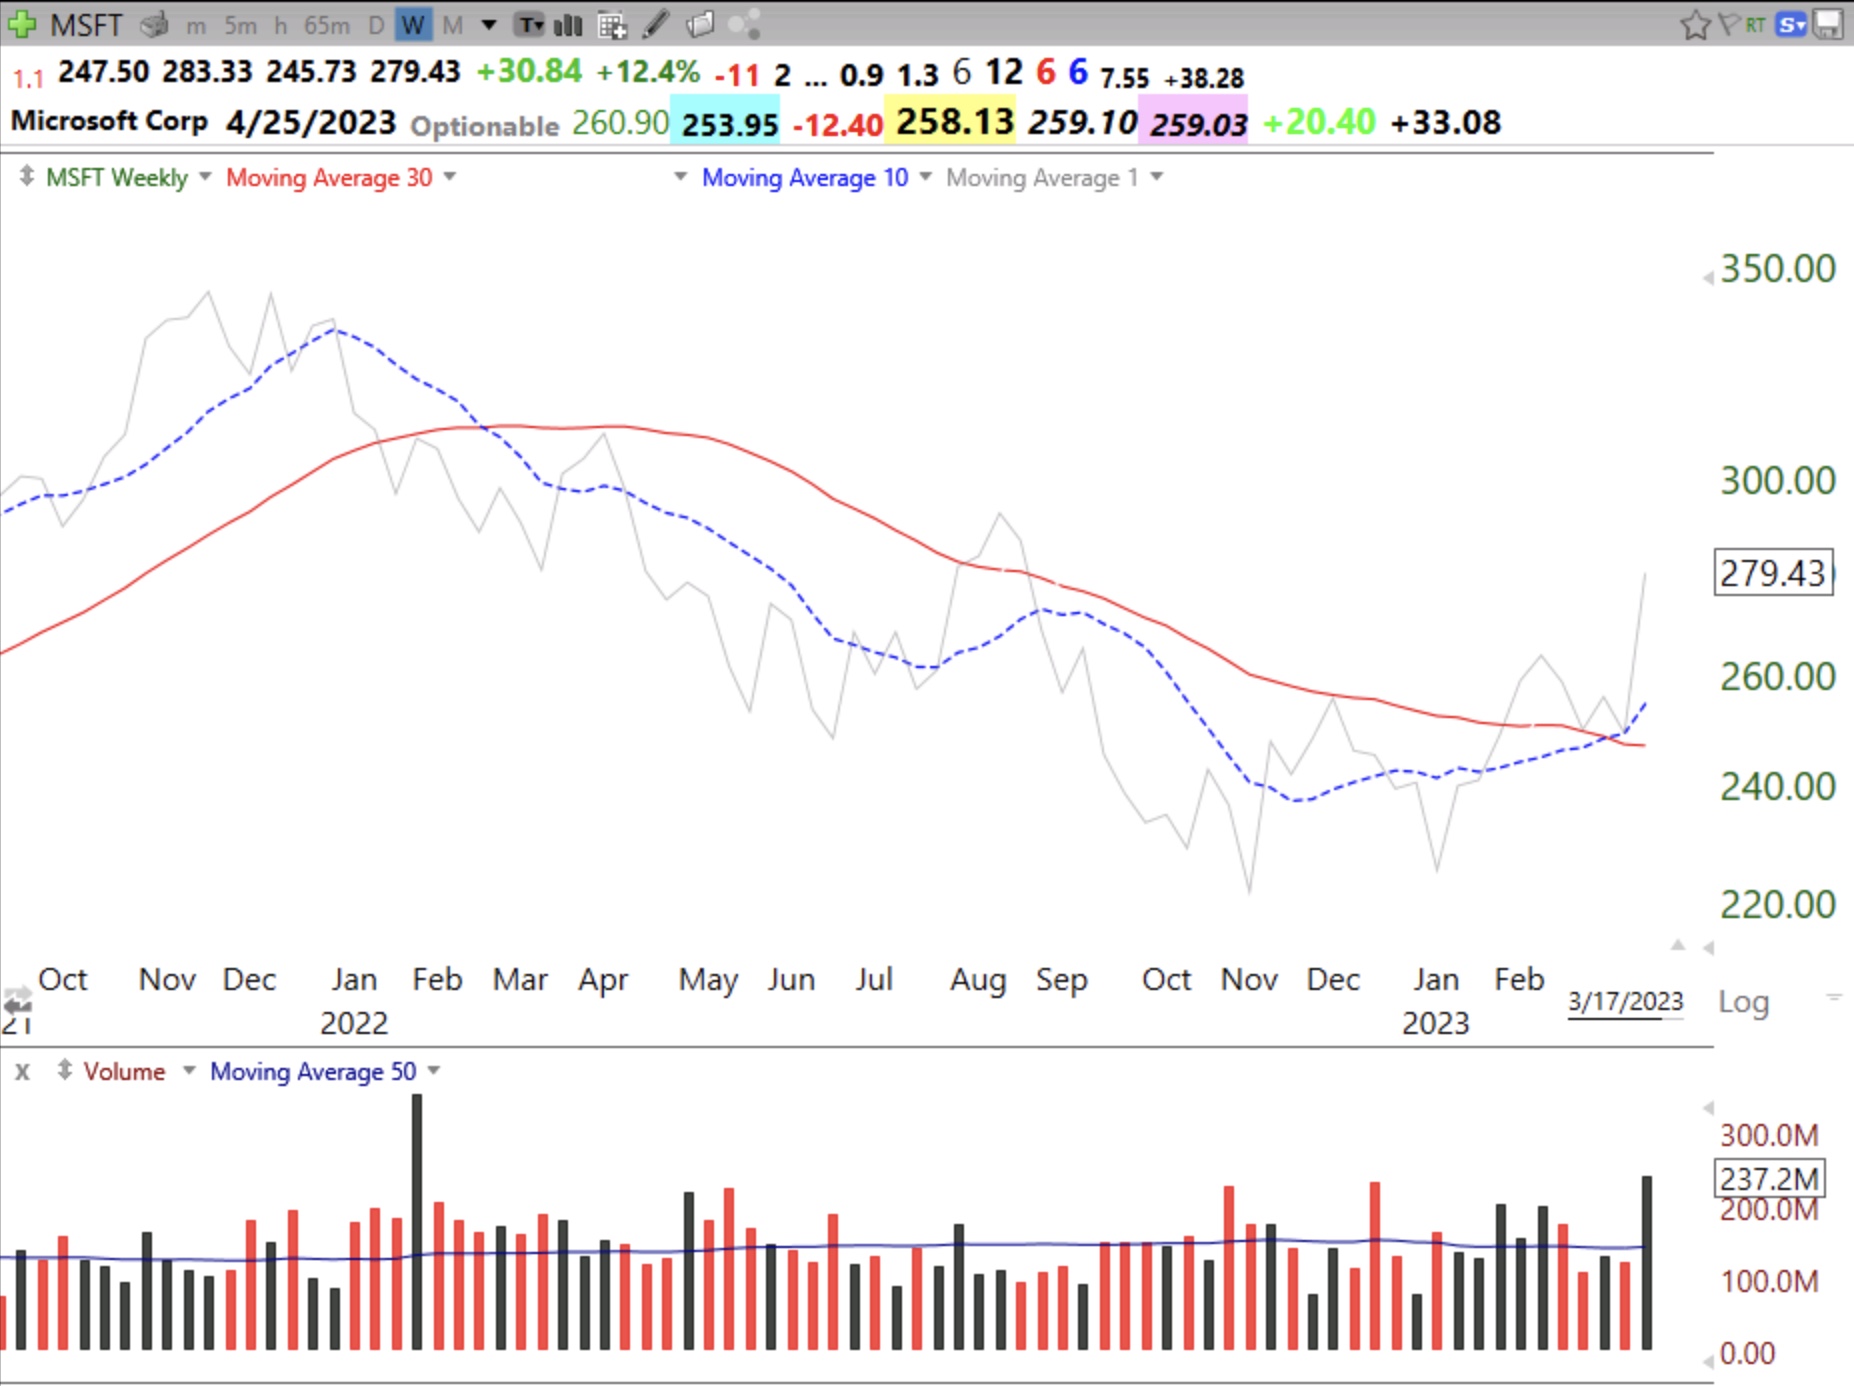
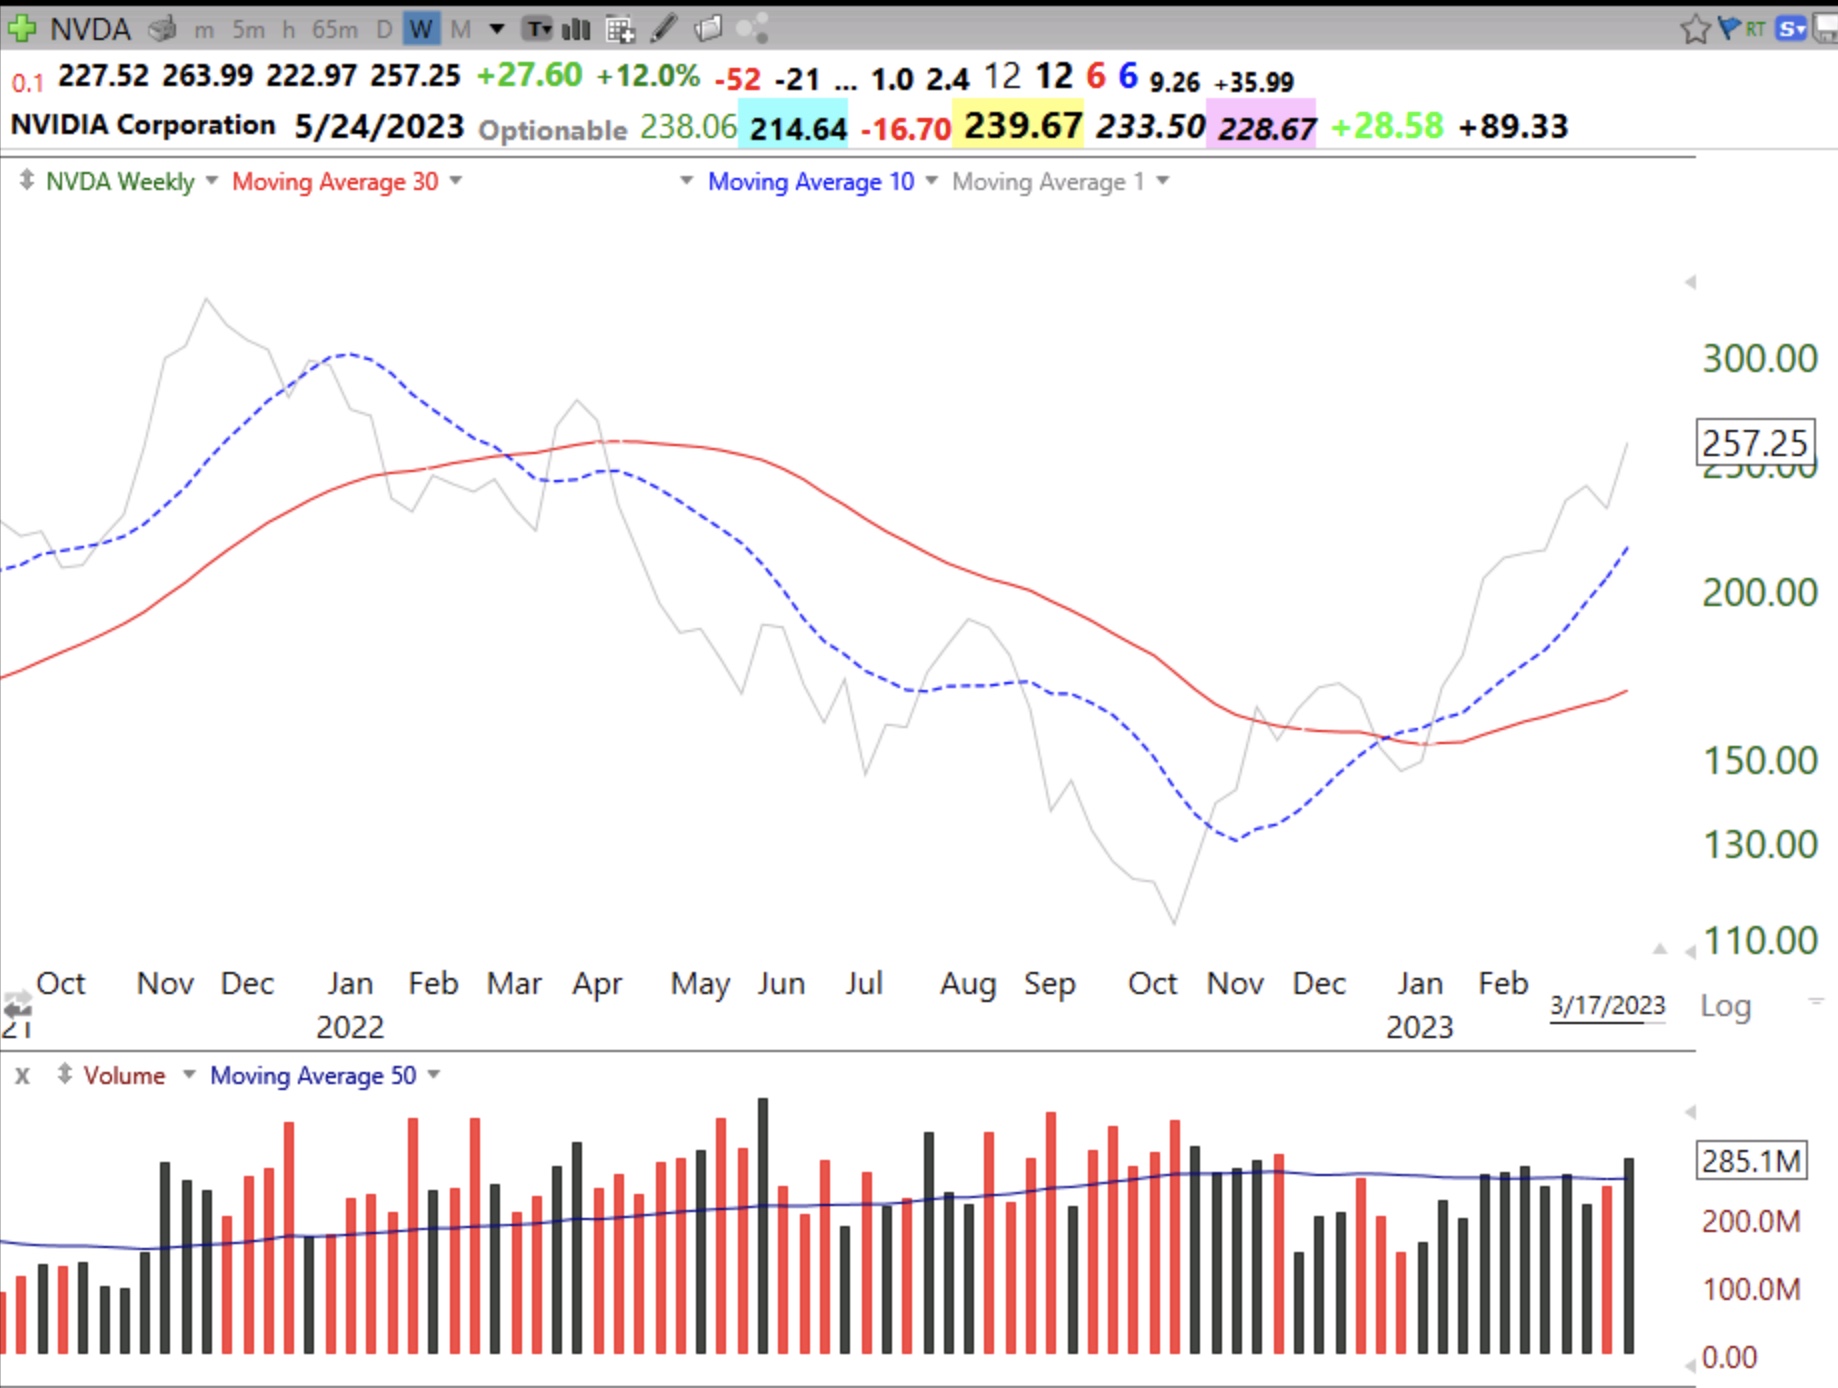
This weekly 10:30 chart of QQQ shows the 10 week average (dotted line) above the 30 week average (red solid line) and the index weekly close (gray line) is above both averages. Note the higher volume last week. This is the pattern of bottoms. The final evidence for me of a new longer term up-trend will be if the 30 week average should turn up. My accounts are mainly in cash with a very small position in TQQQ (because of Day 1 of the QQQ new short term up-trend) and some QQQ itself. A weekly close below the 30 week average would invalidate the up-trend. Remember, QQQ contains non-financial companies and the absence of banks may be one reason for its better performance. Another reason may be the AI revolution, which could lead to a rise like the one that occurred in the 90s as the internet craze was born. My monthly Kiplinger Retirement Report just came and included a piece discussing 8 AI related stocks, most of whom I would not consider buying because of their long term charts. The only one’s I like are MSFT and NVDA, but they are not near their ATHs yet, see weekly charts…