Note the black volume spikes (up days) since November. Are institutions running to gold for fear of US default?
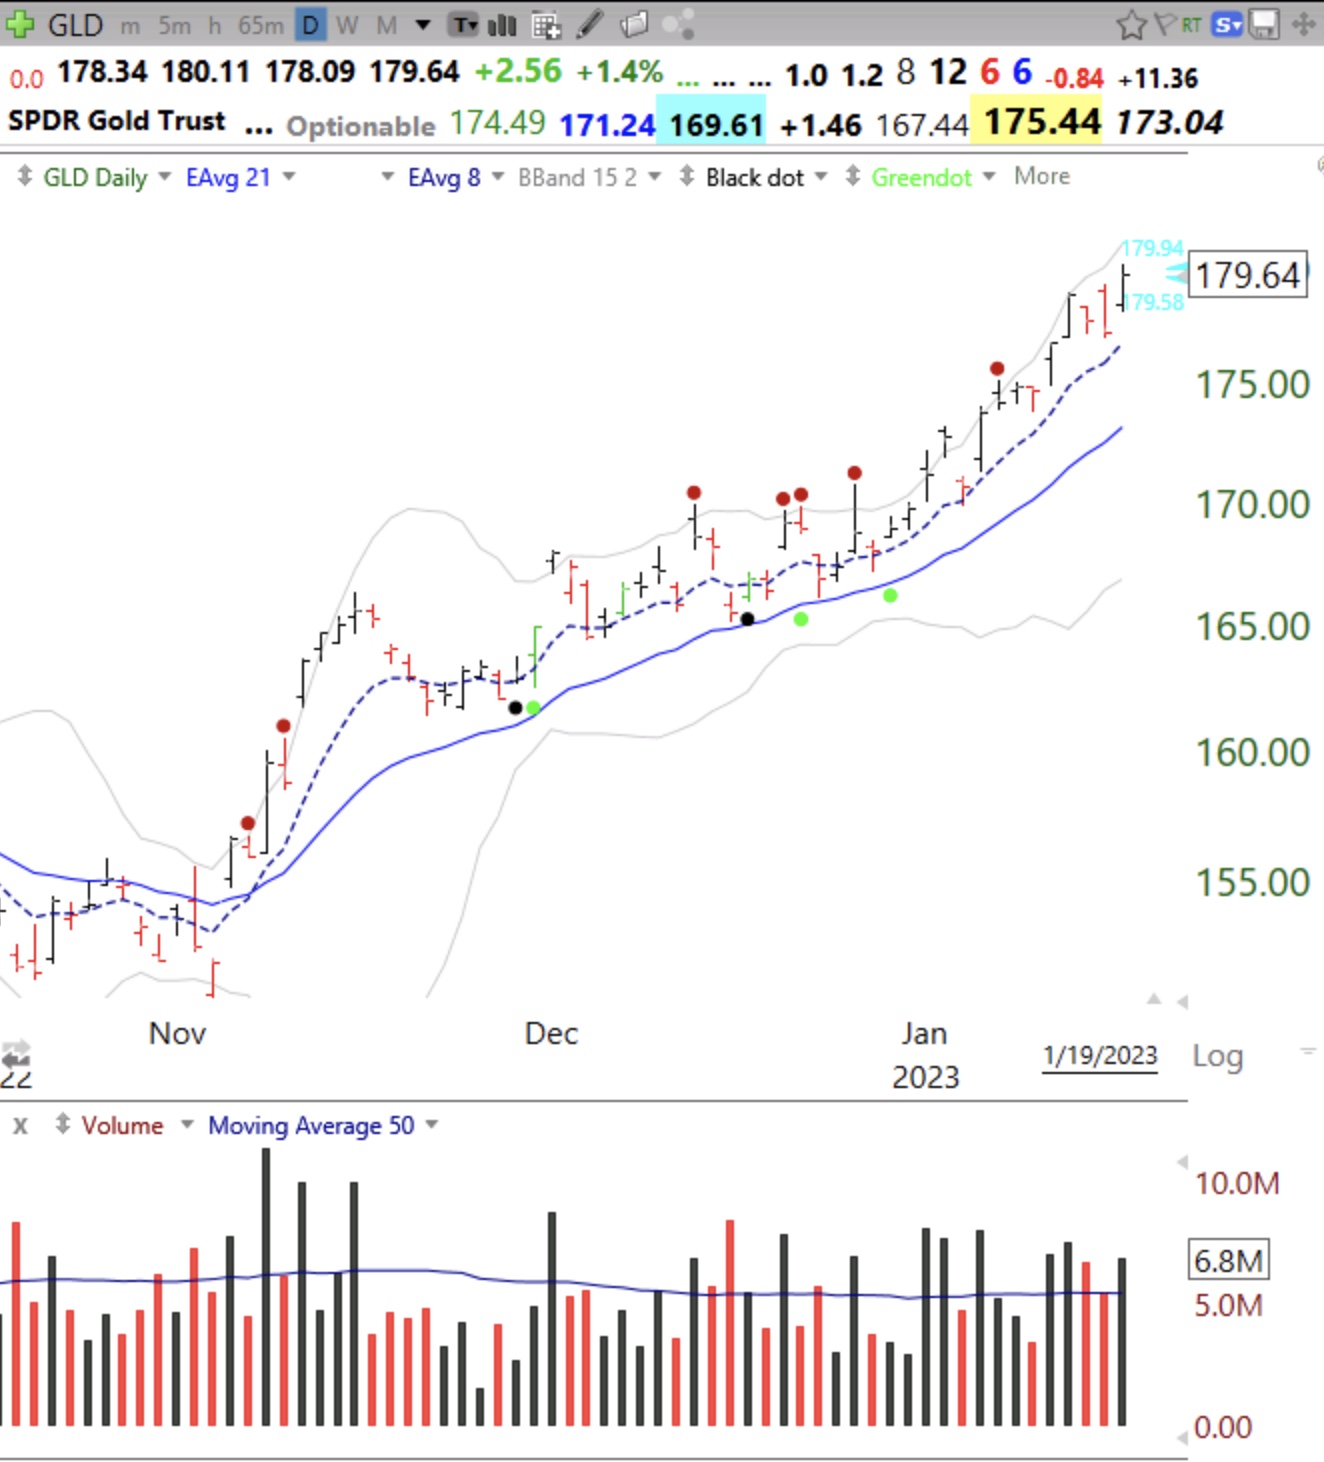
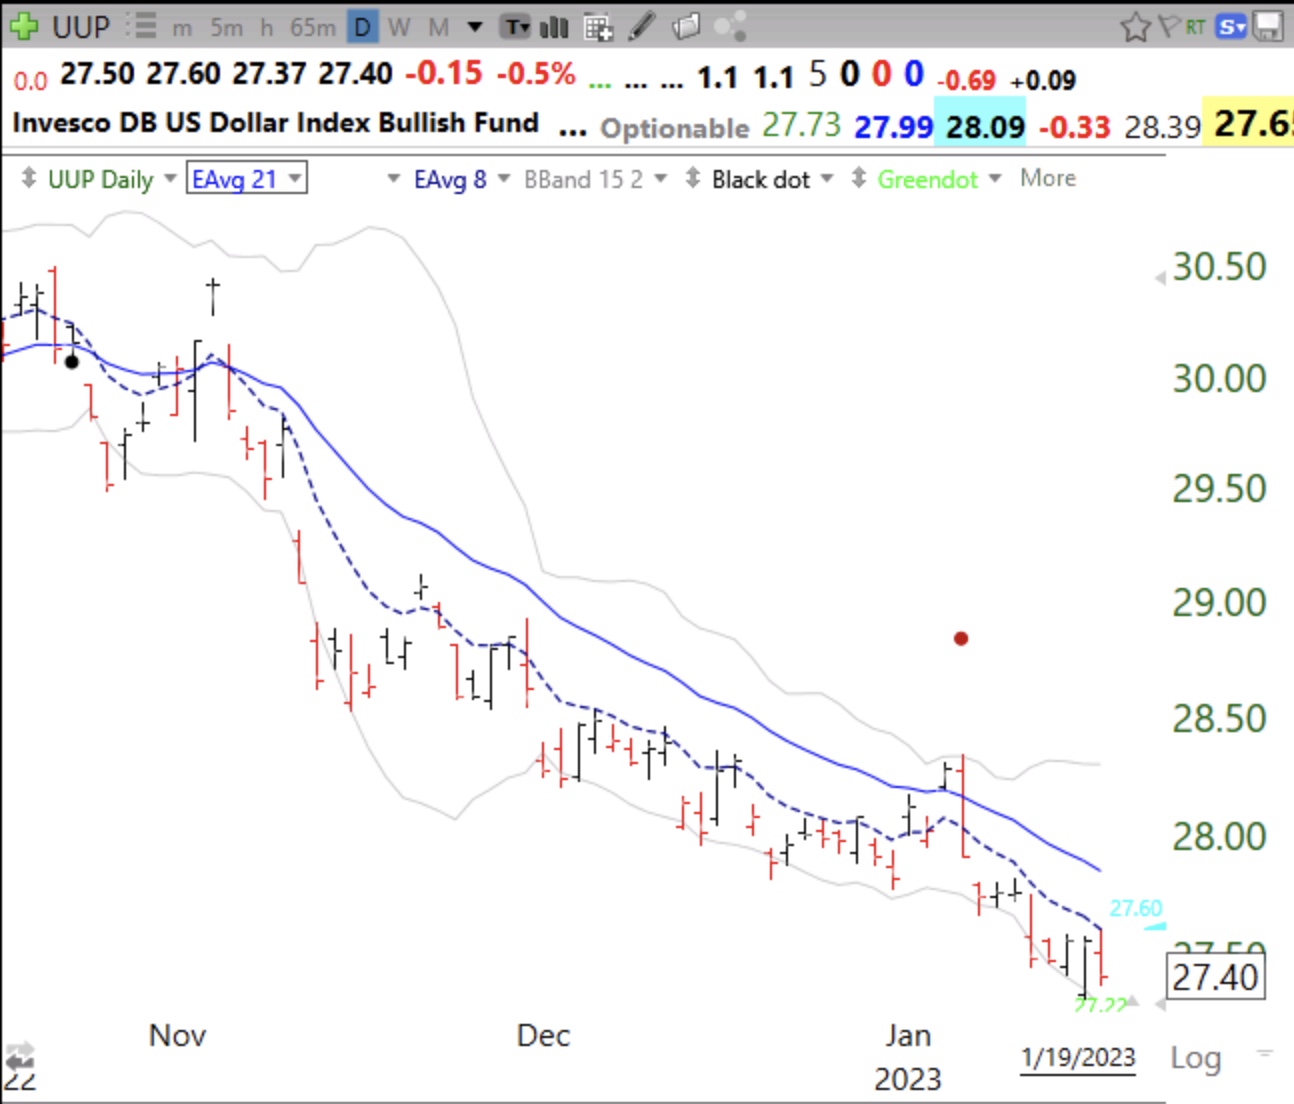
And fleeing the dollar.
Stock Market Technical Indicators & Analysis
Note the black volume spikes (up days) since November. Are institutions running to gold for fear of US default?
And fleeing the dollar.
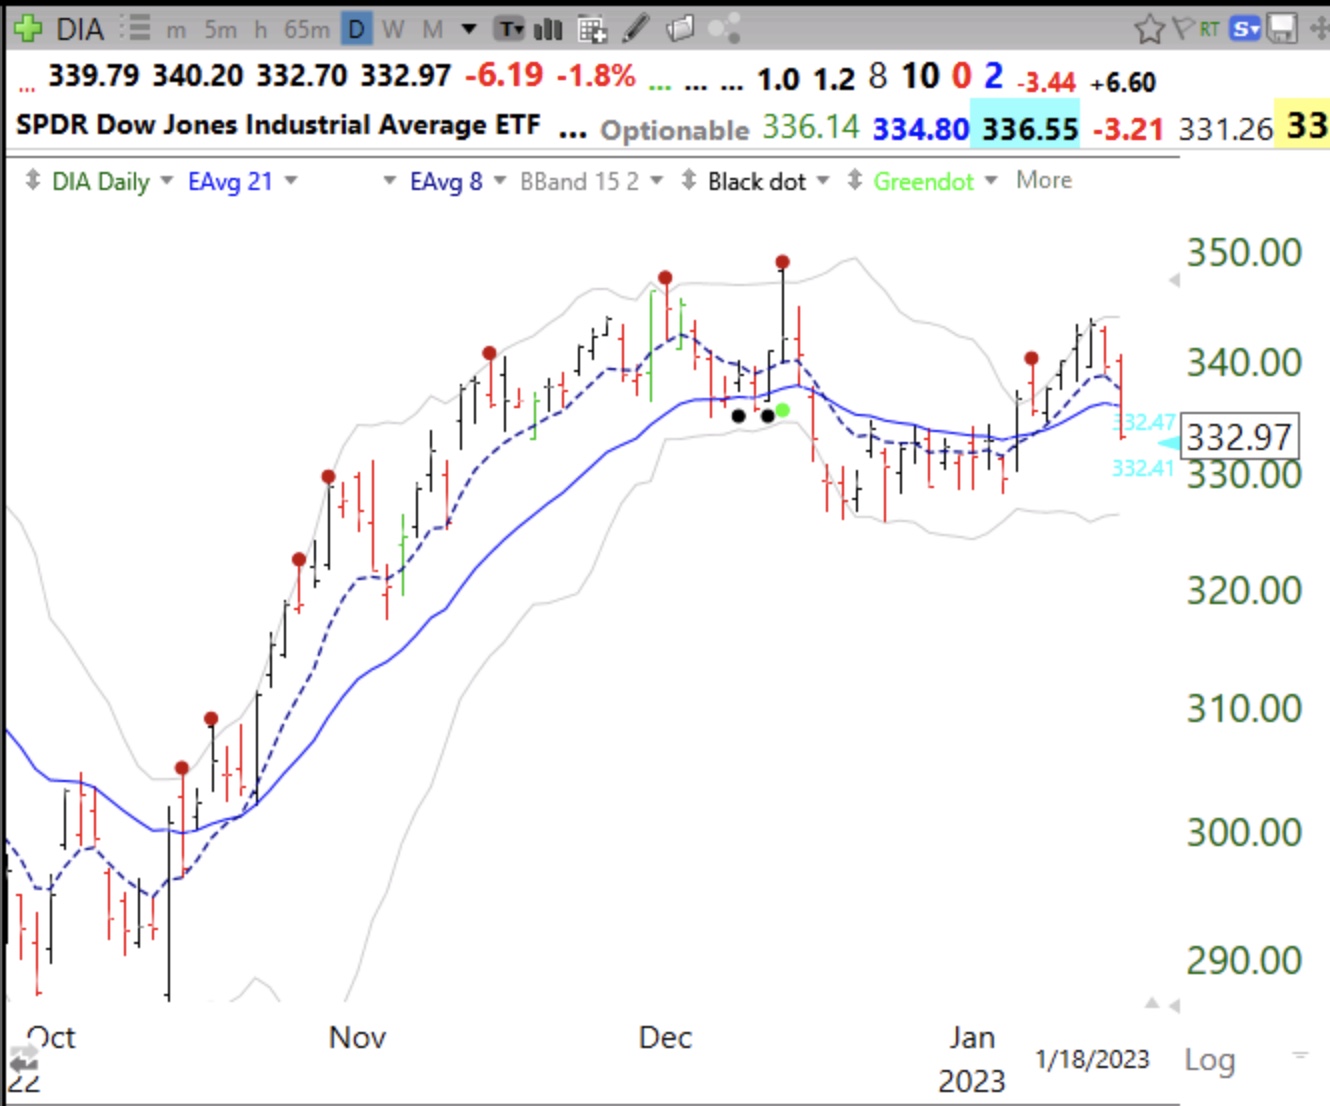
Back in cash for now. Even sold my TQQQ. DIA looking weak. Too many break-downs.
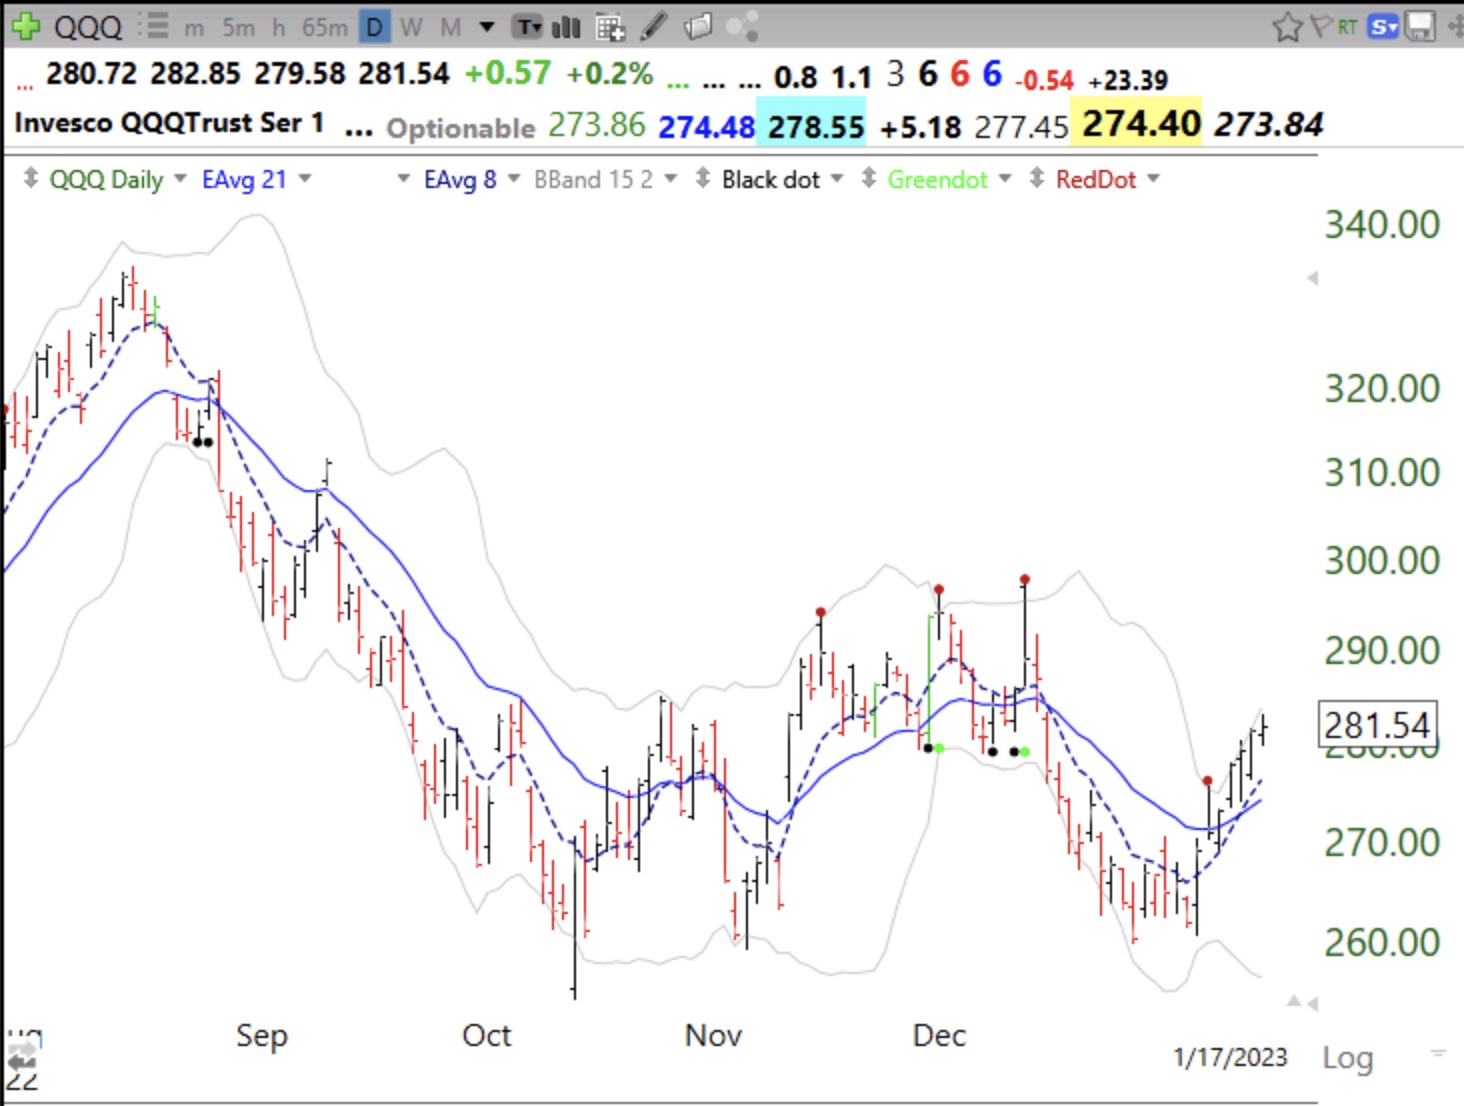
The bottom seems to be holding and the 8 EMA (dotted line) is now above the 21 EMA on this daily chart. Will it hold or break down like it did in December? Only time will tell.